


Graduate Outcomes is still an experimental dataset.
Its novelty means that is difficult to talk meaningfully about trends – we simply don’t know what an unusual year looks like, an issue compounded by the fact that this second year of data (2018-19 graduates, 15 months on) is very clearly an unusual year, and the first year of a data collection exercise is always an unusual year.
HESA published a detailed examination of the impacts of the pandemic on graduate outcomes last week, and I wrote it up over on Wonk Corner. Bearing in mind the headline drop in graduate full-time employment, I thought – with one eye on a reanimated TEF and an OfS outcomes measure consultation – I’d take a look at some of the ways graduate outcomes may be used in future.
A graduate satisfaction survey
The three “reflective” questions – on activity utilising what you have learned, fit of current activity with future plans, and whether activity feels “meaningful” – feel a little like asking graduates how satisfied they are with the outcome of their higher education experience. As we already ask final year students specifically about course and provider experience in the National Student Survey, I wondered whether the NSS predicts reflective question responses.
At a top level, at least – we don’t get the reflective questions by subject area and provider – there doesn’t appear to be a relationship. Student satisfaction (I’m using question 27 % agree for 2019) and graduate satisfaction (I’m using “I’m using what I learnt during my studies in my current activity” % agree for 2018-19) don’t correlate.
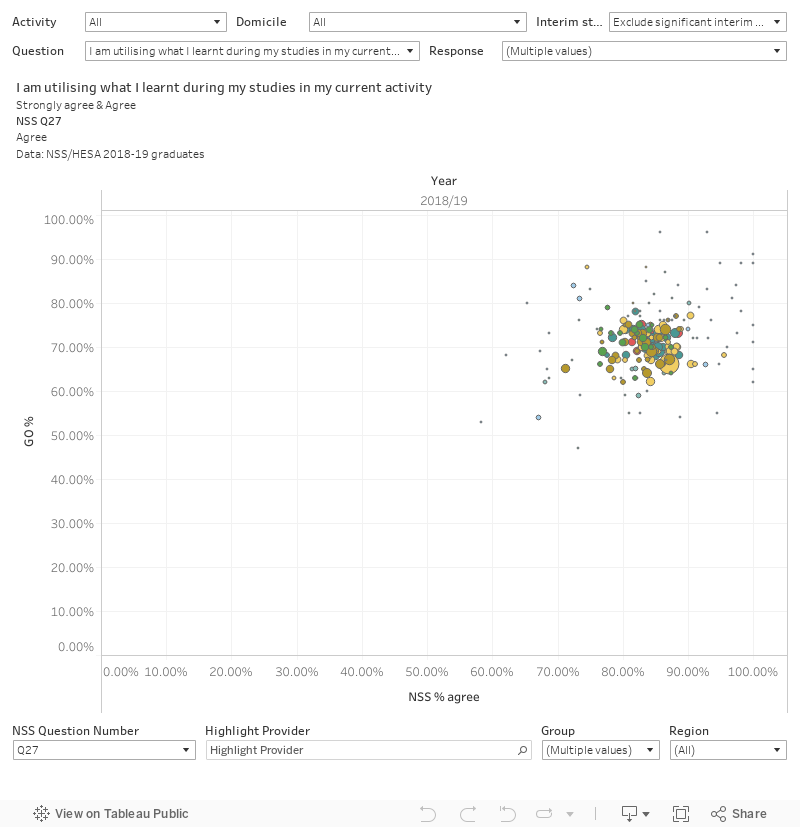
There’s a lot in this dashboard – you can easily look at any NSS question via the filter at the bottom, or look only at employed graduates using the controls at the top. The independence of these two variables might well be at the root of the DfE concerns about the national student survey – or reflect the traditional criticism that “satisfied” students don’t become fulfilled graduates. Use the provider highlight box at the bottom – or the usual filters by group and region are there (alternative and FE are filtered out by default but you can easily add them back).
Critiquing output measures in your TEF narrative statement
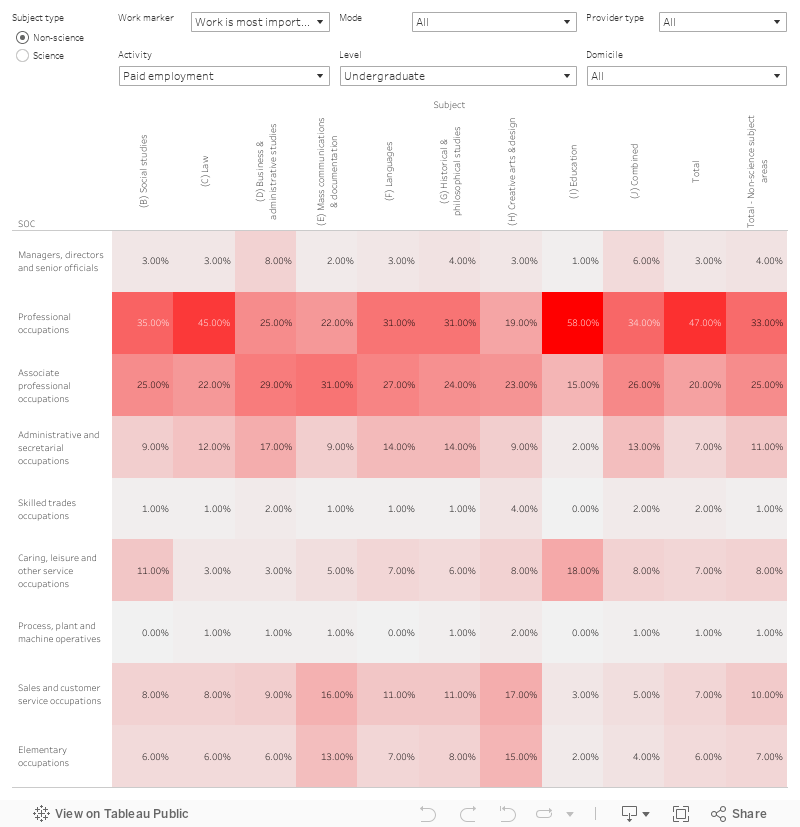
If we are going to use “highly skilled employment” as a measure of quality (even in the bastardised version linked to the nine top SOC groups that is common in higher education), the debate is very quickly going to turn to which subject area within a provider is contributing to a low score. It’s not simple to get this information from the HESA data, but here’s one way you might approach it.
First of all – which subjects tend to lead to employment of any sort? This chart defaults to look sector-wide, but you can use the provider filter to check how you are doing against that baseline.
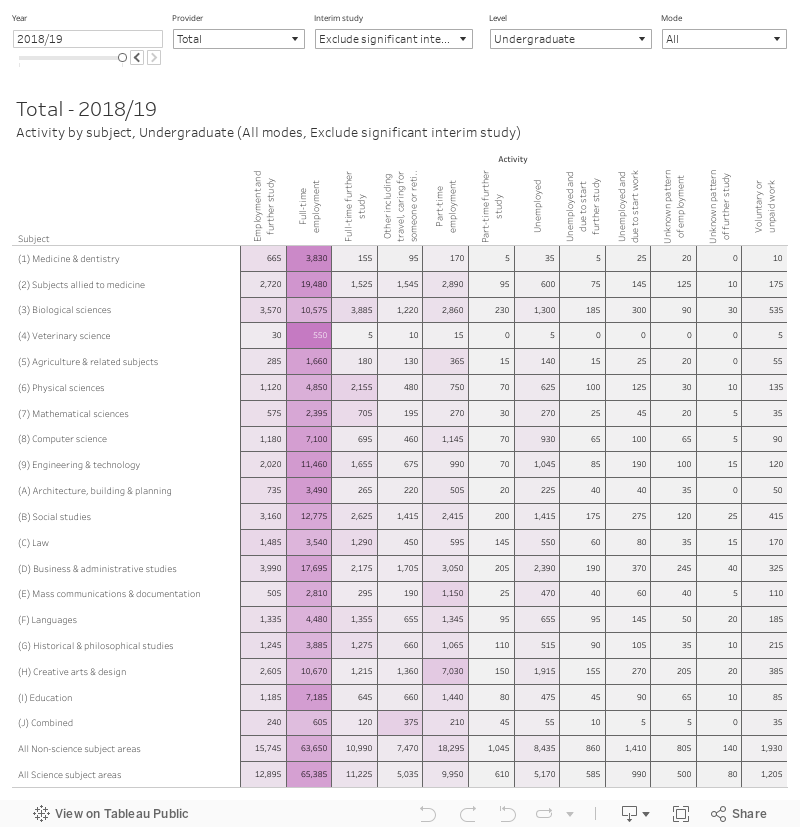
We can see, for instance, that creative arts graduates are more likely to work part-time – an issue I’ve been over in detail on the site before. This feature of choosing to make your way as a creative professional has an impact on both salary and reported job skill level, and it is important to distinguish employment market effects from subject of study effects. A sensible output measure (one that isn’t based on LEO for example) would take this into account.
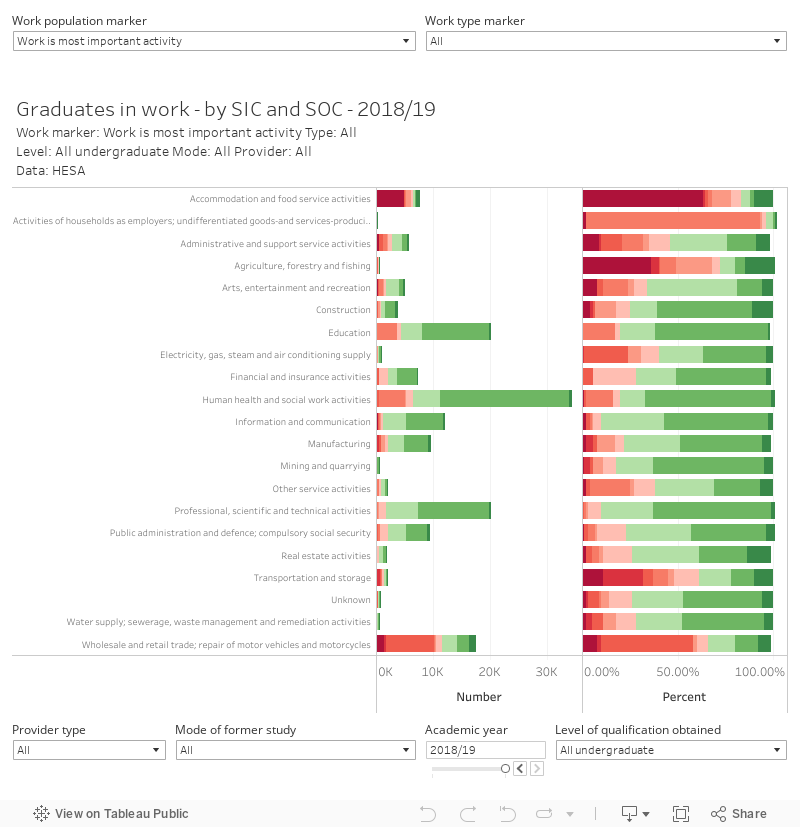
Regionality is another factor – OfS has already taken a look at this, but there is a lot more nuance to be found if you work through graduate outcomes. For instance, what industry do your graduates tend to work in? Is it a valuable local industry that is not flattered by SOC classifications? Here’s a map:
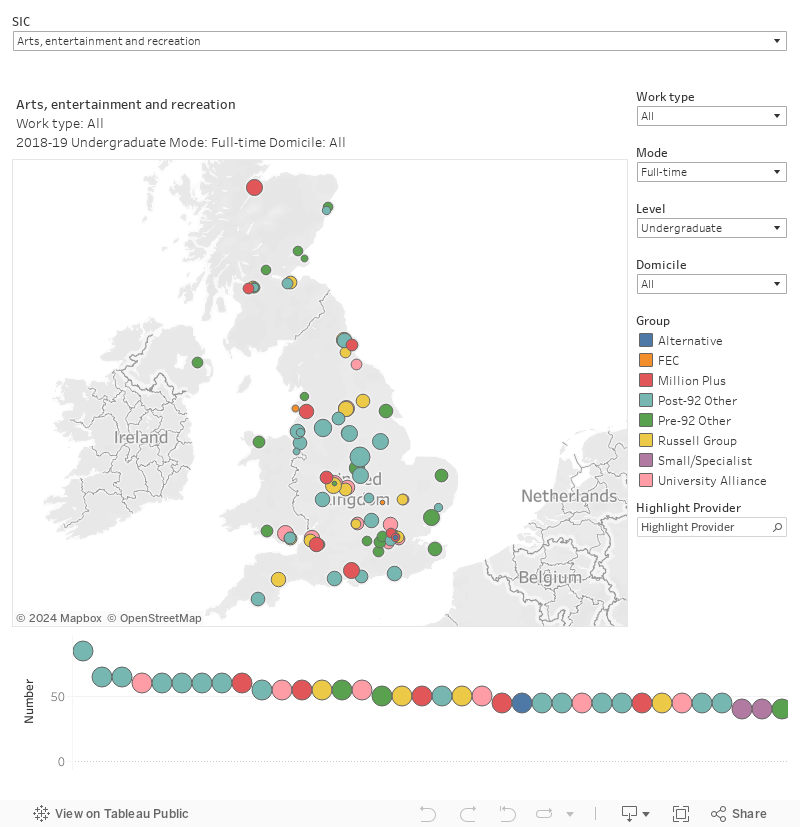
We don’t get the impacts of industry on skill level at a provider and subject level – but even a look by provider offers a few hints.
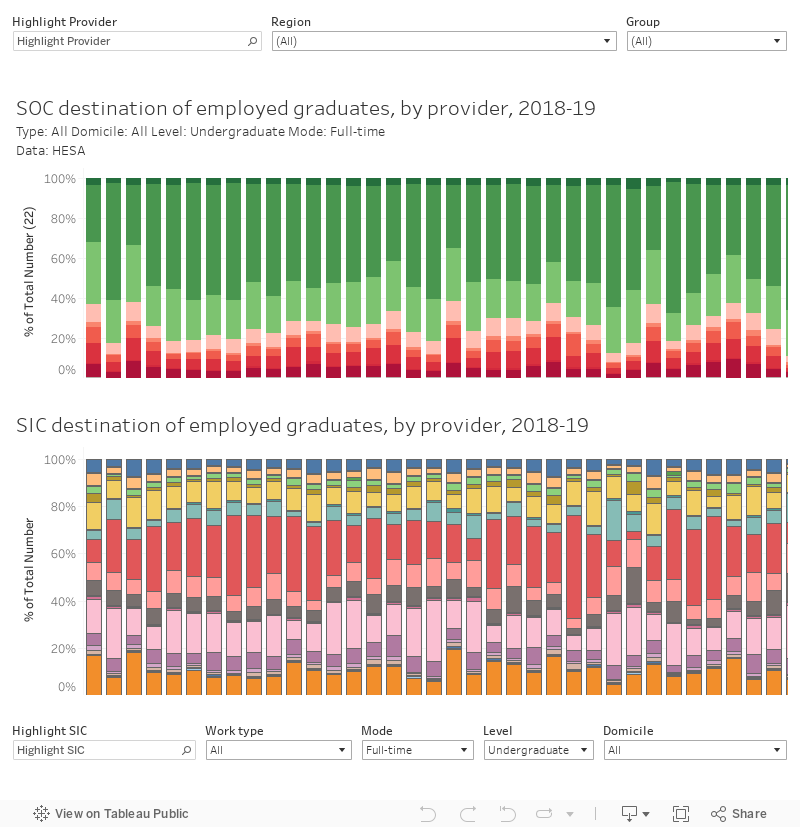
Couple this with a SIC/SOC plot for the whole sector (what skill level – SOC – do graduates working in a particular industry – SIC – have?) and we’re starting to see patterns. If your provider offers courses that prepare graduates for careers in agriculture, accommodation, logistics, or trade you may have a problem.
Level 4 and Level 5 technical qualifications, anyone? Let’s hope we don’t use these output metrics to assess the quality of those new courses.
Scratching the surface
Graduate outcomes is a rich dataset, but not a mature one. We are still getting a feel for what normal looks like, and response rates are not quite as high as we’d hoped. There’s still bits that I’d like to get at that aren’t published – for instance, our question above would best be answered by a version of this graph by provider:
It is equally possible, however, that as we get to know the data set we might find that this isn’t the issue we are interested in. Even well established releases are modified on occasion to take account of new pre-occupations.


There’s also still flaws in the question wording and data. Over 1 in 5 of our respondents who listed their MIMPACT as “Unemployed and looking for work” were in work. The MIMPACT option should be “Unemployed” with a follow up asking if the respondent is looking for work or unavailable for work (retired/caring/travelling). The current wording is attracting respondents who are looking for work while IN work and not just unemployed graduates. Not to mention the dreadful quality of SOC coding for some industries.
While graduates can report a MIMPACT (Most Important Activity) of ‘unemployed and looking for work’ and also say they are in work as one of their range of activities, they don’t get represented as unemployed in HESA statistics unless they don’t report employment as any of their activities. Regarding SOC coding we released two separate reports in April, one evaluating the SOC coding processes, and the other looking at inter-coder reliability. Readers interested in evidence for the quality characteristics of our approach can find out more at: https://www.hesa.ac.uk/news/29-04-2021/occupational-coding-accuracy-graduate-outcomes
“graduates can report a MIMPACT (Most Important Activity) of ‘unemployed and looking for work’ and also say they are in work as one of their range of activities” – then your survey is broken.
The analysis above is looking at MIMPACT not using your derived fields.
Maybe that’s true, but it’s also possible for a grad to think that being mostly unemployed is the most important thing to them….For example, if you’re working 5 hours a week in a cafe, it might be that ‘being (essentialy for the remaining 30/35 hours) unemployed’ is the most important thing to them.
It is, however, highly confusing and will lead to a wide intrepretation of the data. How will league tables interpret, how will Progress interrpet, TEF, every indivdual University….
Dan – can you point us all to exactly how HESA have dervied thier metrics? The recently published data doesn’t give us the methodology around how ‘Unemployed’ is determined (at least nowhere obvious)….
I find it more than a little bit infuriating that we’re two years in to GO data now, and no one within the sector can agree on how we calculate rates. Considering the importance of the metric, it absolutely needs a set of calculation guides. HESA use MIMPACT for highly skilled, but they don’t publish anything for highly skilled employment and further study (probably the most important outcome); the new PROCEED metric uses ALLACT only for highly skilled and further study, the old TEF used MIMPACT + ALLACT, what’s the use of XACTIVITY if it’s not being used anywhere?! Some tables in HESA let you narrow down to first degree whilst others are only UG / PG… we’re all here trying to understand our performance but it’s impossible to get them to match all other published data. HESA – you’re generally pretty great but onward used of GO data is a mess. Please please please sit down with the OfS, produce some guidance on how you calculate, and then we can all relax a little and stop looking like we haven’t got a clue what’s going on when management ask us! Why are there so many different ways of interpreting an outcome? I agree above that the survey is broken (and don’t get me started on the length), which is crazy as it’s so new! I’m normally a positive and rational human being but GO makes me so mad!