


There’s lots of people in the public sector with university-level qualifications.
Some of this is because degrees are required for particular professions, or particular roles. Some of it may also be because graduates are attracted to the idea of serving the public in this way, or to addressing the complex social, technical, and economic problems the nation faces.
But, as Claire Taylor (the Vice Chancellor at Plymouth Marjon University) notes, the public sector is in turmoil – staff recruitment and retention is in freefall. Teachers and NHS staff may be the most visibly discontent, but there are all kinds of roles in all kinds of industries that are also struggling.
Universities clearly have a role to play in the public sector staff pipeline – but before I consider that it might be worth going through current numbers.
What’s a public sector?
According to the Office for National Statistics, there are around 5m (full time equivalent) staff in the public sector.
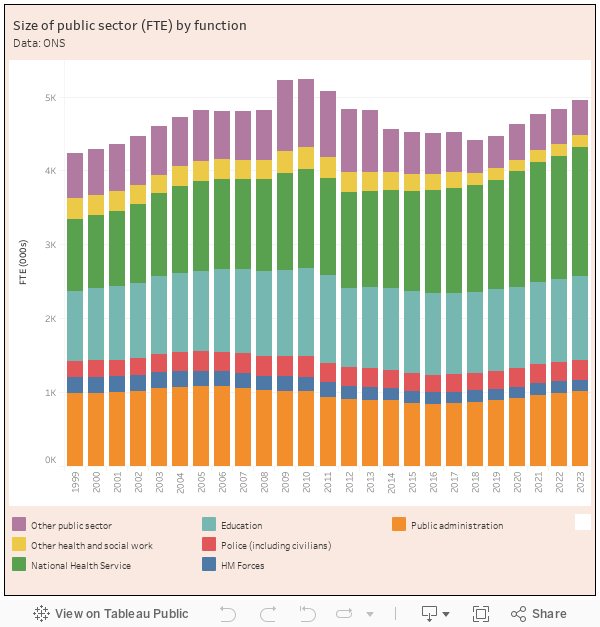
The NHS is the largest single public sector employer (with 1.7m FTE staff as of 2023), closely followed by the education system (1.19m FTE). Other notable sectors within the public sector include uniformed services like the police (both officers and civilians and the armed forces, plus we get around 1m FTE staff in “public administration”, which may be closer to the “civil service” of popular imagination. In all of these cases, the temptation is to leap straight to imagining the “big jobs” (doctors and nurses in health, teachers in education, officers in the forces and the police) but there are a huge variety of roles within each industry.
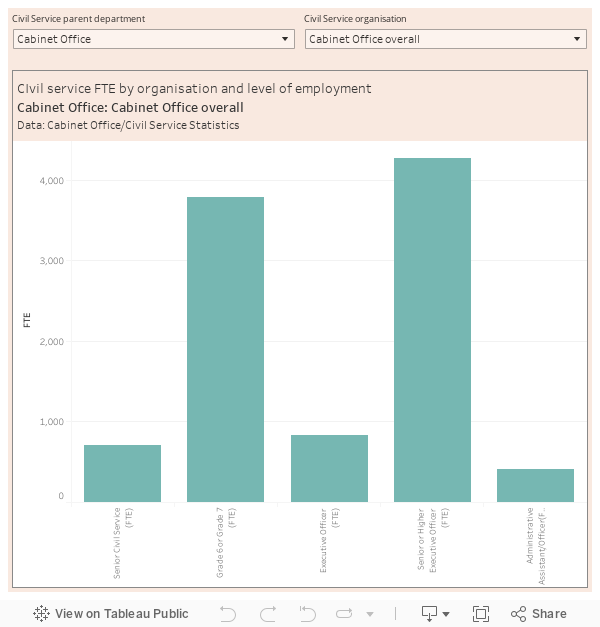
On that – there are 487,665 FTE staff in the Civil Service (which includes departmental staff and those working for departmental bodies) according to the Cabinet Office. They offer all kinds of statistics on the work these people do and their personal characteristics, but nothing on the qualifications they hold. I did write to ask them, but was rather off-handedly told to make a freedom of information request. I shall.
The Institute for Government has had a little more success on this front, noting earlier this year that civil servants are more likely to be on a higher grade these days (though “grade inflation” – promoting staff early to avoid losing them to the private sector – may be a factor here), and notes that 53 per cent of the senior civil service (permanent secretaries and directors general) attended just two universities – Oxford and Cambridge.
What I can show you is Civil Service FTE by grade and organisation. It is likely that higher grades will tend to have university (or equivalent) qualifications.
Maybe this morning’s Public Accounts Committee inquiry hearing into the Civil Service workforce will offer us some more answers.
What qualifications do public sector staff hold?
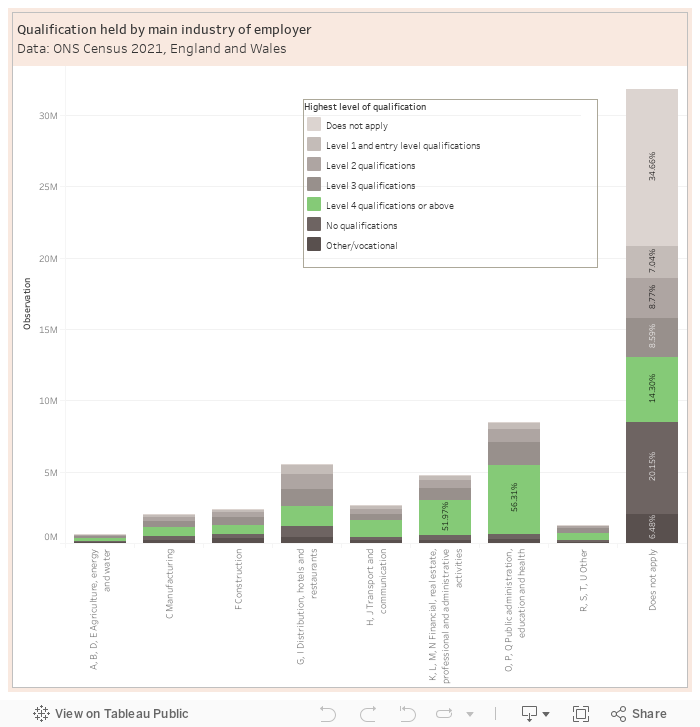
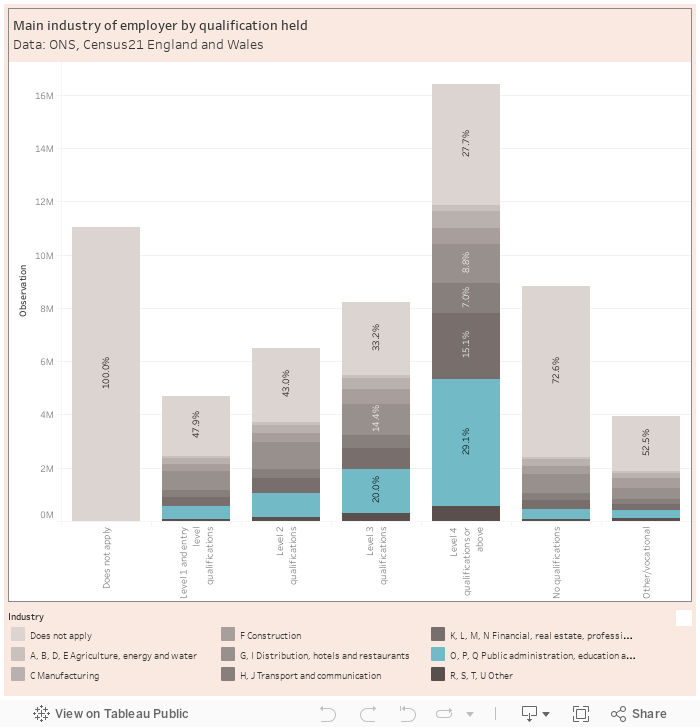
If you bunch together public administration and defence, education, and health/social work (Standard Industrial Classification – SIC – groups O, P, and Q) you get a reasonable approximation of the public sector in census statistics. Here I’m using stats from 2021 for England and Wales – slightly older data, but probably the best available in terms of quality. You’ll see that 56.6 per cent of workers (headcount) in this broadly drawn public sector have a level 4 or above qualification as their highest qualification – higher even than the 51.9 per cent of staff in a broadly drawn “professional services” sector.
Put another way, 29.1 per cent of people in the UK with a degree or above work in the public sector. The public sector is is a major graduate destination.
Approaching this from another angle, HESA’s Graduate Outcomes data gives us a sense of which providers are particularly exposed to the public sector as a graduate destination.
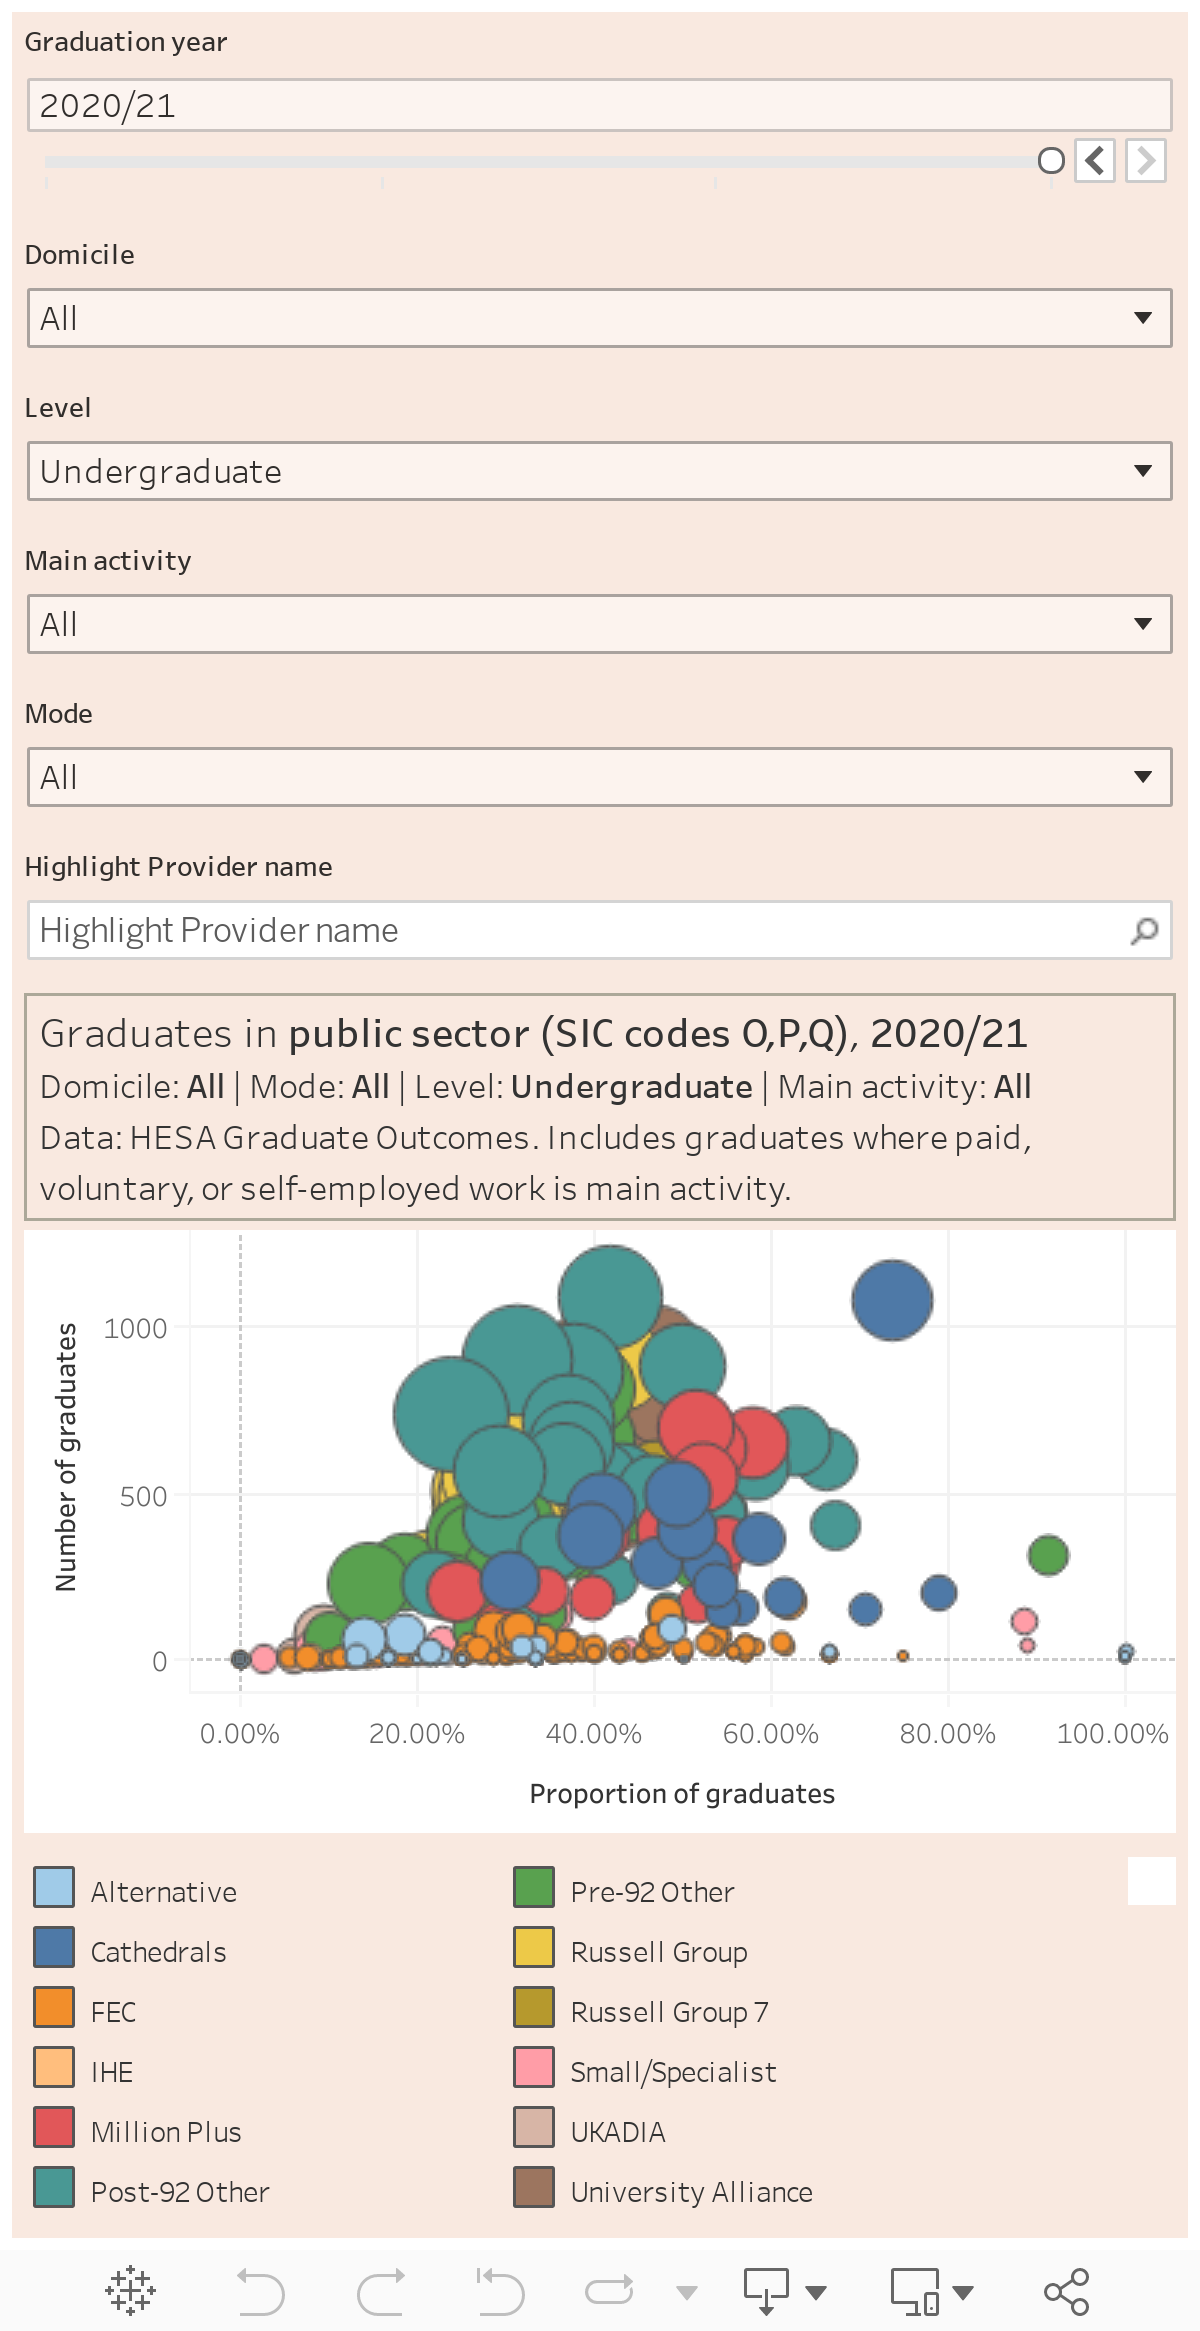
I’ve got the number of graduates from each provider on the y-axis, and the proportion of all graduates from that provider on the x-axis, and you can filter by graduation year, and domicile (as well as the characteristics of the course that graduates took, and whether they are paid, self-employed, or volunteer staff – the view looks only at graduates with one of these three as their “main activity”.
I’m aware this is a very interesting chart, so there’s a version here that allows you to look at SIC codes in more detail.
You can see that even large traditional universities are sending at least a third of their graduates into the public sector, and for many more modern and vocationally focused providers – or specialist providers – the proportion is much higher. Conversely, problems with public sector pay, conditions, and recruitment will clearly have an immediate impact on the “outcomes” measures of quality that regulators and politicians are increasingly beginning to favour.
As HESA research confirms: if the graduate premium is falling, don’t blame graduates or providers – blame low public sector pay.
Is there a geographic aspect?
It’s fairly common knowledge that graduates tend to like to live in large urban conurbations – often the one they graduated in, or in London. These large, densely populated, areas also tend to have a lot of schools, hospitals, and government offices about the place – so it might be the case that we are seeing the public sector as a most likely job in that area rather than as a career goal.
This is important in that graduates may be doing jobs they are overqualified for because these are the jobs that are available locally, and that would mean that the data above overstates the graduate impact on the public sector workforce.
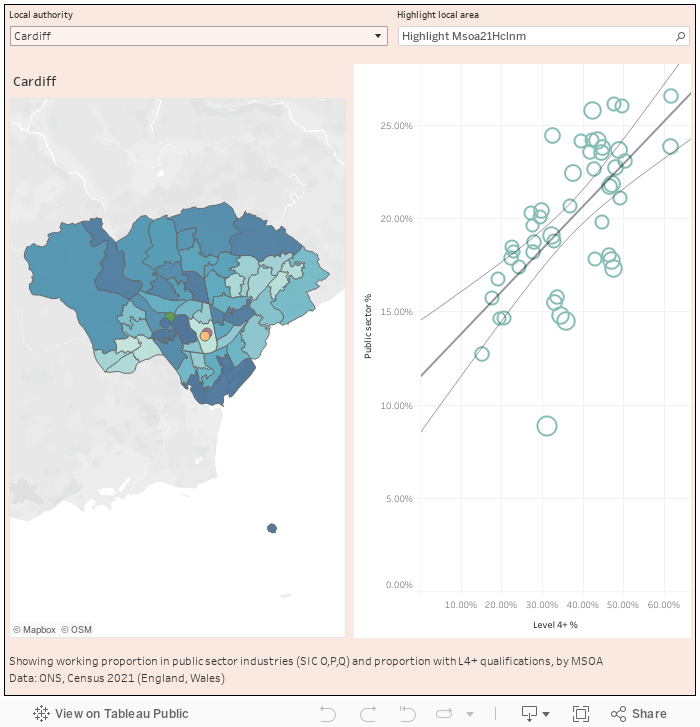
This dashboard shows the likelihood of public sector employment and the likelihood of level 4 and above qualifications in every MSOA in England and Wales (your Covid-19 flashback will be telling you that these are those areas with between 500 and 1000 households that we use for statistical purposes). I’d honestly suggest that you use the local authority filter to check out areas of interest, where you can see that even in these tiny MSOA areas if there are more graduates there will be more public sector workers – as people are likely to commute to work beyond their MSOA this suggests to me that we are looking at a graduate effect not a local effect.
If you are mad enough to look at all areas at once, after Tableau stops loading you will see something else interesting – there are two types of area with a high proportion of public sector workers. One is, as discussed, areas with loads of graduates in (usually parts of big, regional, cities) – the other are often quite rural areas with a proximity to large armed forces bases.
What are the university take-aways here?
One thing that has surprised me is the low proportion of academic staff that come from the public sector, outside of health – and likewise the low proportion of academic staff that leave university employment for the public sector.
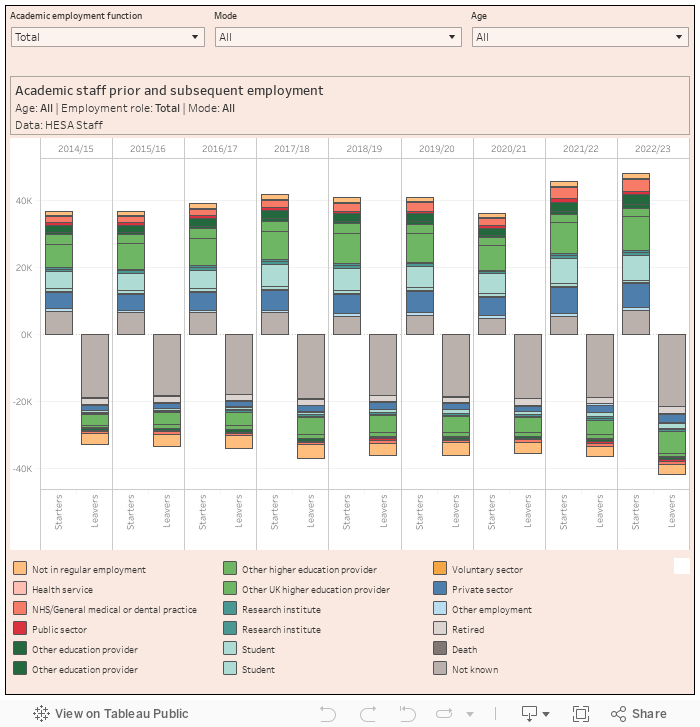
Data quality isn’t fantastic in this corner of the HESA Staff record, but it is clear that after within-sector movements (other providers, students, research institutes) staff are more likely to enter from, or leave to, the private sector.
Given the huge number of graduates that will work in the public sector it feels like a trick is being missed in employing staff with direct and relevant experience. Likewise, the public services may well benefit from research-informed practitioners moving into it. Again salary and working conditions may be playing a part here – though universities often lag behind the private sector for those with a high level of experience and expertise, the public sector is a very poor third place in this particular competition.
Universities and the public sector can and do work together to provide student placements, particularly where (like in education or healthcare) this is a professional requirement. But a pool of staff moving between universities and the wider public sector would surely benefit everyone.