


I am writing this under embargo in anticipation of a new media storm about student satisfaction rates, to be swiftly followed by the usual tired writing-off of the National Student Survey as a source of useful information about anything at all.
One side will complain that universities have not sufficiently bent to students’ wishes; the other that they already have too much. Meanwhile, in university offices across the country, the annual internal wars over NSS action-plans will begin.
Sadly, I’m sure that this will all largely miss some of the most useful aspects of what is one of the largest single surveys run in the UK. When used properly and with due care, its results are a rich insight into students’ learning behaviours, and those of their teachers. That has been helped this year by the inclusion of many new and improved questions.
New tricks
The survey is now longer than we are used to, with new questions introduced on ‘learning opportunities’, ‘learning community’, and ‘student voice’. These have been borrowed from the National Survey of Student Engagement used in North America, and the first two of these new categories in particular focus on areas of the higher education experience consistently shown to be important for effective learning.
| Scale | 2017 Results |
|---|---|
| The teaching on my course (Q1-4) | 85 |
| Learning opportunities (Q5-7) | 84 |
| Assessment and feedback (Q8-11) | 73 |
| Academic support (Q12-14) | 80 |
| Organisation and management (Q15-17) | 75 |
| Learning resources (Q18-20) | 85 |
| Learning community (Q21-22) | 77 |
| Student voice (Q23-25) | 73 |
| Students' union (Q26) | 57 |
| Overall satisfaction (Q27) | 84 |
The new questions appear to be a renewed challenge to the sector. The now removed ‘personal development’ section would typically score nationally in the low-80s, but the new ‘learning community’ and ‘student voice’ sections find themselves with average scores of 77 and 73 respective. However, the higher scores for the ‘learning opportunities’ section, including questions on “opportunities to explore ideas or concepts in depth” and “opportunities to apply what I have learnt” are good news.
Old problems
Meanwhile, the usual low performers – ‘assessment and feedback’ and ‘organisation and management’ – continue to struggle. Organisation and management – largely unchanged from the old survey – is a particularly worrying case of overall scores falling backwards on where they have been in previous years.
Well-structured courses that provide a coherent experience at programme level have been stressed as vital to effective learning by educationalists such as Graham Gibbs. Universities often find that students’ complaints in this area can also come down to more instrumentalist (but nonetheless important) concerns, such as the usefulness of their timetable, the distance to travel to classes, or the efficacy of a department’s administration.
Anxiety over ‘assessment and feedback’ NSS scores, meanwhile, continues to be the most significant pedagogical and student satisfaction challenge facing British universities. Interestingly, this is the only section of the survey where national averages for part-time students are higher than for full-time students. However, part-timers are (perhaps unsurprisingly) significantly less likely to respond positively on the learning community questions.
As for overall satisfaction? Well, this is the least robust, least precise, and least useful of all the questions on the entire survey, with scores at the institutional level prone to statistically insignificant ‘bunching’. Yet sadly, it is the one question on the survey to get the most media and political attention, and most likely to feature in league tables (though thankfully not in TEF). It is a shame that HEFCE reinforces this by only releasing institutions’ question 27 results in its embargoed press release to journalists. Overall satisfaction is down by two points to 84%, but it is impossible to know what this is really telling us. I’m sure Andrew Adonis will have some ideas…
The future will be better tomorrow
HEFCE intends to review the impact of the new survey on providers and students. The new students’ union question in particular will be under close review. The new question is the result of an unhappy compromise between HEFCE, HEPISG, NUS and students’ unions – it didn’t even pass muster in cognitive testing – and no easy answer has yet been found to how it should be included (if at all) going forward.
In the meantime, the inclusion of general ‘student voice’ questions puts even greater pressure on universities to demonstrate engagement and responsiveness to student feedback. The analysis and action-plan meetings will begin in earnest. The best advice I have read on how to approach the use of the NSS comes from Gibbs*:
“NSS scores for a degree programme provide a useful indication of where there might be problems, but rarely point directly to the cause of problems let alone to possible solutions…
There is also scope for offering guidance on the likely causes of, and possible solutions to, low scores on the different scales of the NSS, ideally linked to case studies of successful interventions to improve NSS scores. The NSSE provides more direct indications of what practices to pay attention to than does the NSS, and its pilot use in quality enhancement should be supported.”
Hopefully the new questions in NSS borrowed from NSSE will help universities’ follow Gibbs’ advice and provide new guidance for where universities can continue to improve. Learning engagement and learning communities are vital components of a quality higher education experience, and their inclusion in NSS – for all its flaws and shortcomings – could even be more of a boon to enhancing teaching quality than TEF.
*I also recommend this excellent HEA publication from Alex Buckley
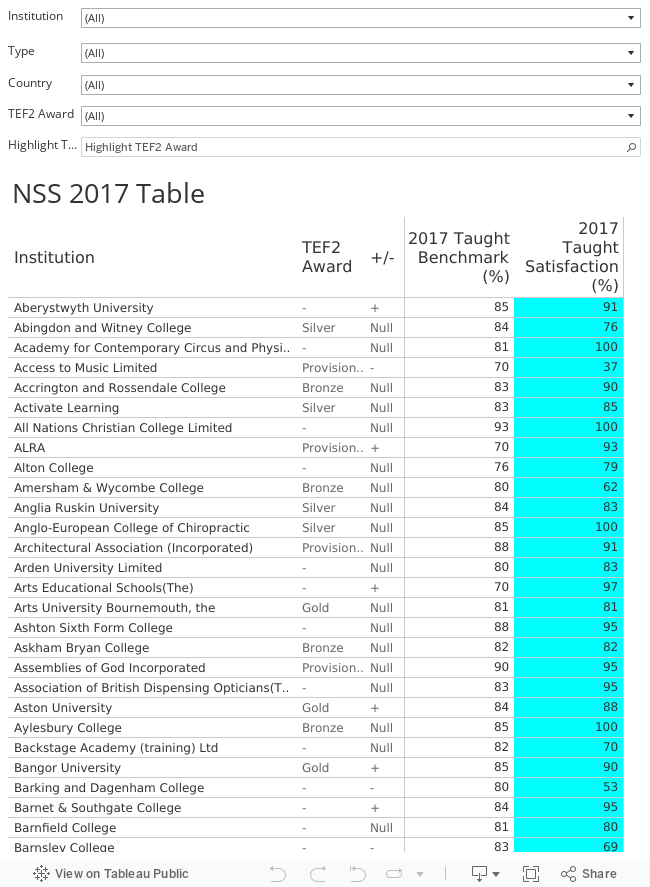
NSS results
These results are published as released by HEFCE under embargo, and include institutions’ TEF results for comparison. The table includes HESA benchmarks, and a +/- flag for scores significantly above or below it.
Twelve higher education providers are missing from these results as a result of this year’s NSS boycott. Read more about that here.
Further results
You can now use our interactive heat map to analyse the full NSS results for higher education institutions for all 27 questions of the survey. We have also included a mean score of all the questions, as per the ‘Good University Guide’ method.
This table is best viewed in full screen mode.
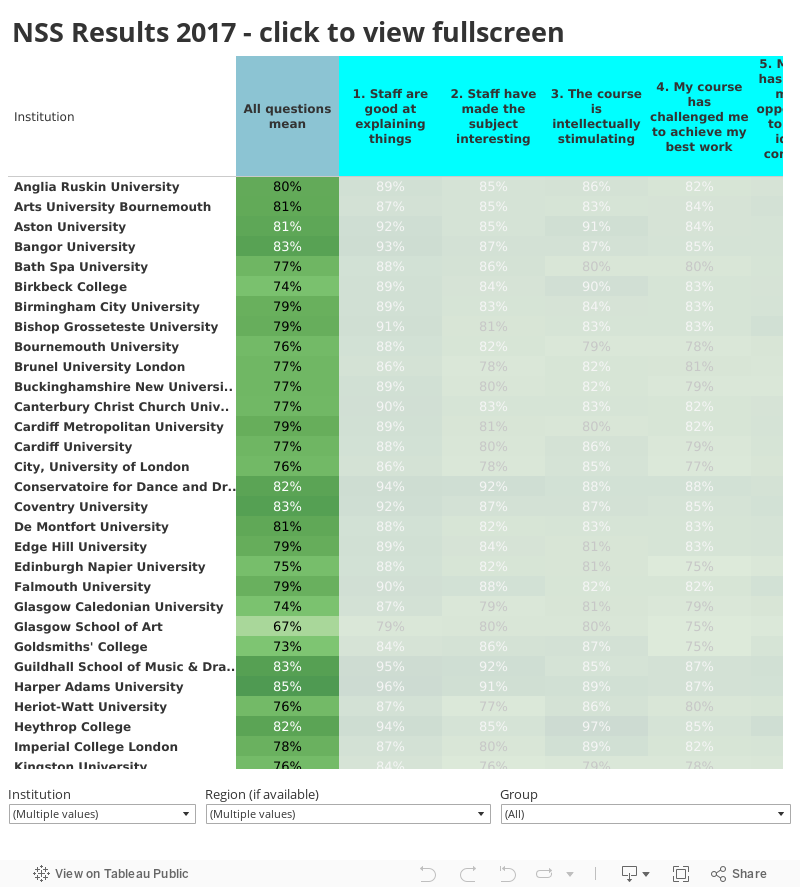
Correction – The above table was amended on 23/8/17 to correct the first column labeled ‘GUG method average’. This simple mean of the 25 ‘core’ questions of the survey is not the same as the method used in recent years by the Good University Guide.