


More graduates, some 61 per cent of the 2020-21 cohort, are in full time employment than at any point since 2017-18.
If you look at work more widely defined (employment in any mode and unpaid work) the figure is 82 per cent, bring in further study as a positive destination and we get to an impressive 90 per cent.
That’s the headline finding for the most recent release of HESA’s graduate outcomes dataset. The survey, conducted around 15 months after each cohort graduates, saw 355,050 responses for the 2020-21 cohort – a 43 per cent response rate (rising to 46 per cent if partial completions are included). The 2020-21 cohort completed their studies during the Covid-19 restrictions, with the final (and largest) group graduating in May 2021 just as these restrictions were beginning to be phased out. HESA’s reliably magnificent Lucy Van Essen-Fishman wrote an analysis of the impact of the pandemic on the data earlier this month.
There’s an abundance of data to play with. We learn, for instance, that male graduates are (still) more likely to be unemployed, whereas female graduates are more likely to be in part time employment. White graduates are more likely to be in full-time paid employment than any other ethnic group, whereas Black graduates are the most likely ethnic group to be in part-time employment. In England, graduates from a disadvantaged background (IMD quintile 1) are less likely to be in paid employment than their more advantaged peers. And disabled graduates are substantially less likely to be in paid employment than those without a disability.
More than anything, findings that make me think that there are serious problems in the graduate job market. But it’s also clear we have serious problems with the benchmarked use of graduate outcomes (“progression”) in the regulation of providers.
Positive outcomes
The Office for Students defines positive progression outcomes quite carefully – the official definition covers managerial or professional employment, further study, travelling, caring responsibilities, or retirement as “positive outcomes” – but it is not straightforward to turn the public graduation outcomes into the regulatory indicator. Here’s a couple of ways in while we wait for OfS to do it.
First up, we can ignore some of the stipulations around skill level or study level – this is what it would look like if we considered any kind of employment or further study as positive.
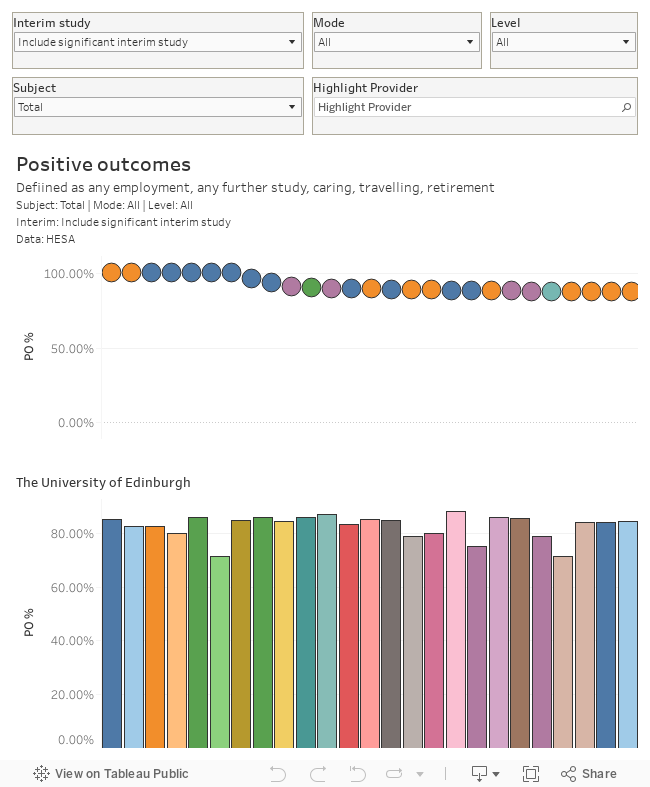
Though this is emphatically not what OfS is interested in, I think graduates in any kind of paid employment or further study 18 months on is a pretty decent outcome and it’s worth noting that smaller providers do very well. For reasons that we’ll get to, the performance of Norland College is particularly of note here.
We do get top level standard occupational codes (SOCs) by provider at top (9 group) level. The sector does tend to take a very simple split of SOC codes to determine whether or not a graduate job is “highly skilled”, so reflecting that I’ve ranked providers by the proportion of “highly skilled” (groups 1-3) graduates in employment.
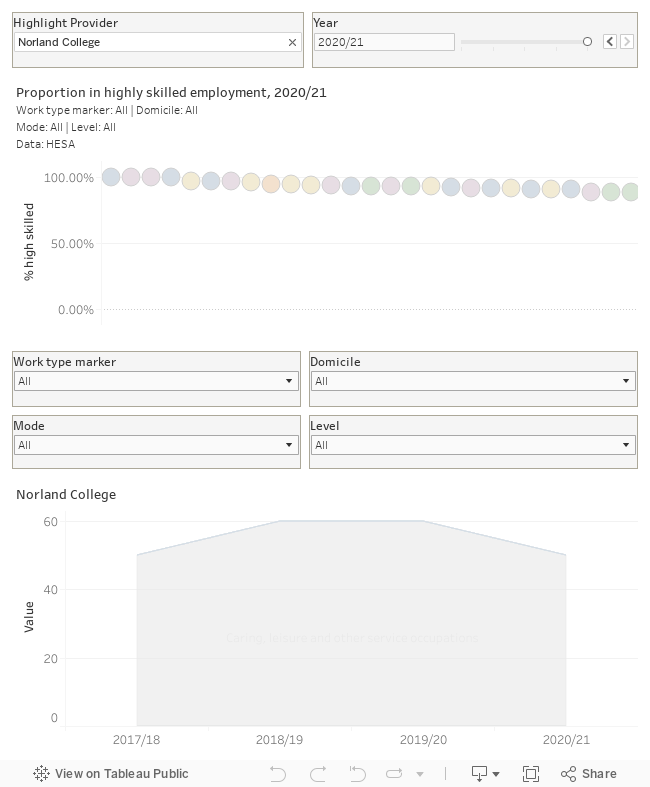
Here you’ll find Norland College, as usual, as the worst performing provider in the sector, with no graduates in highly skilled work. Except if you know that Norland is a specialist provider training childcare professionals to a world leading standard, and every single one of their graduates has taken up a highly skilled (and well paid) role in this field. The way we use SOC codes is hugely limited because we are tying highly skilled roles to the idea of roles we would traditionally expect graduates to do. Norland loses out particularly here, but the effect is felt by many providers who train students for niche roles not usually associated with higher education.
Quality of work
I do have a favourite graduate outcomes measure, but you won’t find it in the published table. Back in 2021, HESA engaged with the debates about job quality in response to the Taylor Review – research Tej Nathwani set out the reasoning for this for Wonkhe readers last year. Basically, we’re short of non-financial measures of graduate employment success other than the widely used but shaky read-across into SOC codes as a proxy for skill level.
Job quality attempts to put numbers on some of the more intangible elements of what happens when you graduate and enter the workforce – covering stuff like the way skills are used, the degree of autonomy available, working conditions, and a sense of purpose. HESA research has found that a simple average of the three “graduate reflections” questions in graduate outcomes (on how meaningful an activity is, whether that activity fits future plans, and whether skills learned during studies are used) is a decent proxy.
For purists, HESA uses the mean of the three scores per response and then aggregates – what I’m showing here is the mean of the three “agree or strongly agree” proportions.
Here’s a plot of this at provider level – I’ve included filters for activity type (full time employment is the default), broad domicile, and the interim study marker. Like all the best rankings it deviates sharply from any ideas of prestige you may have.
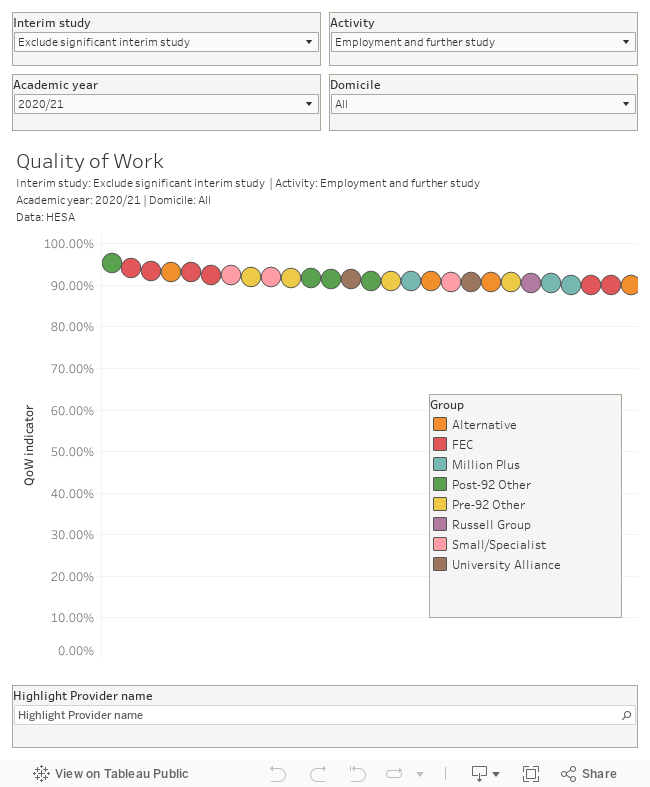
What this is showing, in effect, is a more holistic examination of graduate outcomes than you’ll find in OfS B3 metrics of TEF. Nobody uses this for regulation, or even in newspaper league tables – I’d argue that it deserves a place there.
There are interesting observable effects by subject area and degree classification.
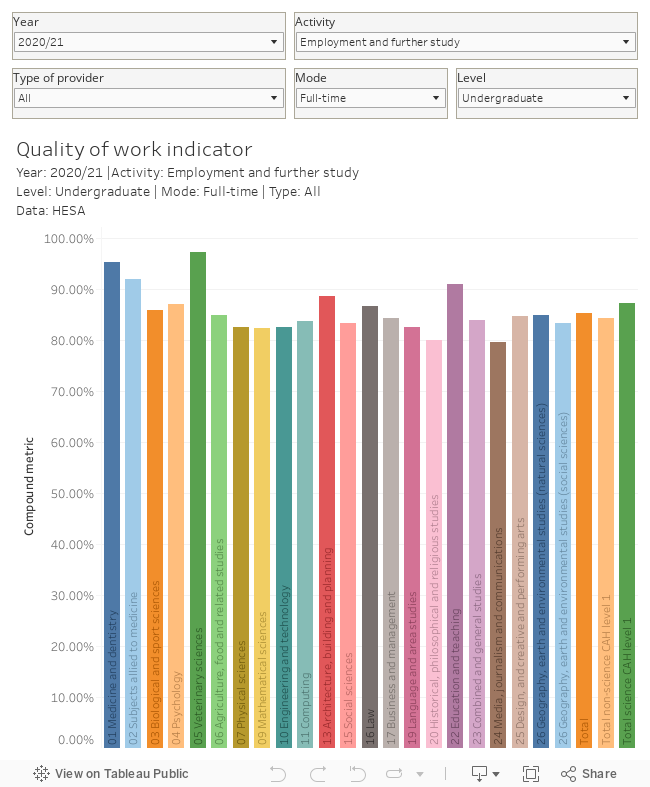
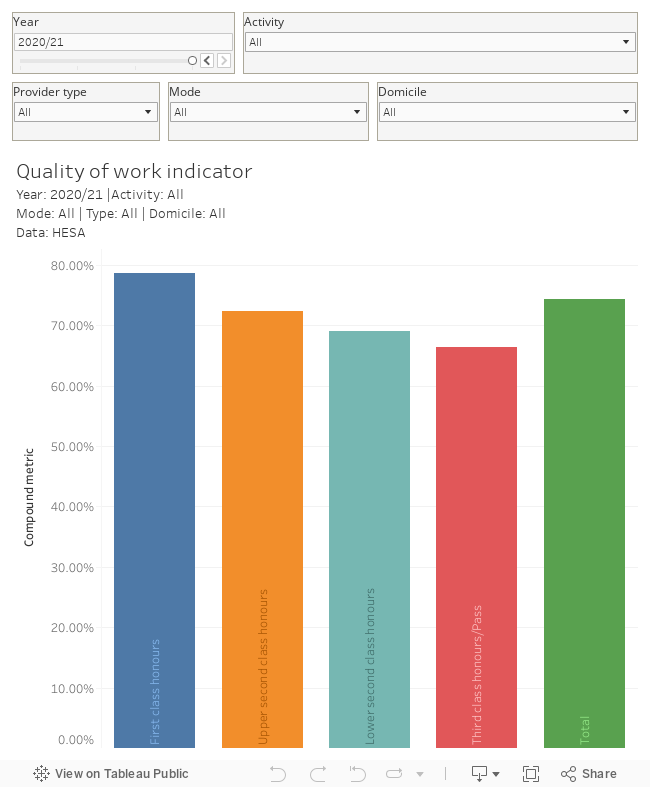
Veterinary science, education, medicine, and subjects allied to medicine seem to produce the most satisfied graduates – what is notable is that the majority of these subject areas lead directly to named careers by aligning closely with detailed professional standards. We also see a clear link between success in studies (first or upper second class degree) and quality of work – suggesting, as we may expect, that more able graduates are finding satisfying jobs more easily.
The downside of this approach is that it attaches a lot of regulatory weight to graduate opinions on one single day. My wonderful Wonkhe colleague Livia Scott notes she completed her graduate survey the day before she was due to hand in her MA dissertation – the fact she was having an “absolute mare” will have contributed to the score for Newcastle University this year.
Other stuff
Graduate Outcomes also contains information about average graduate salaries – these are self-reported and there’s fun to be had in a future episode when we compare these with LEO data. That’ll be a data nerd piece, because everyone serious agrees that there’s no place for salary information in the regulation of higher education quality and standards.
Likewise, we will return to graduate wellbeing considerations – it makes sense to compare the questions to similar ones asked by the Office for National Statistics, and that’s worth taking the time to do properly.
One thing I like is the use of standard industry codes (SIC) to tie down a question of great interest to applicants – what do graduates actually end up doing? It’s long been known that even quite vocational courses, like law, don’t lead to a single career path – this is the data that spells it out (note that there is data issue glitch relating to medicine that seems to double count results for that subject group, and as the data is offered only as percentages I’m not sure what is going on).
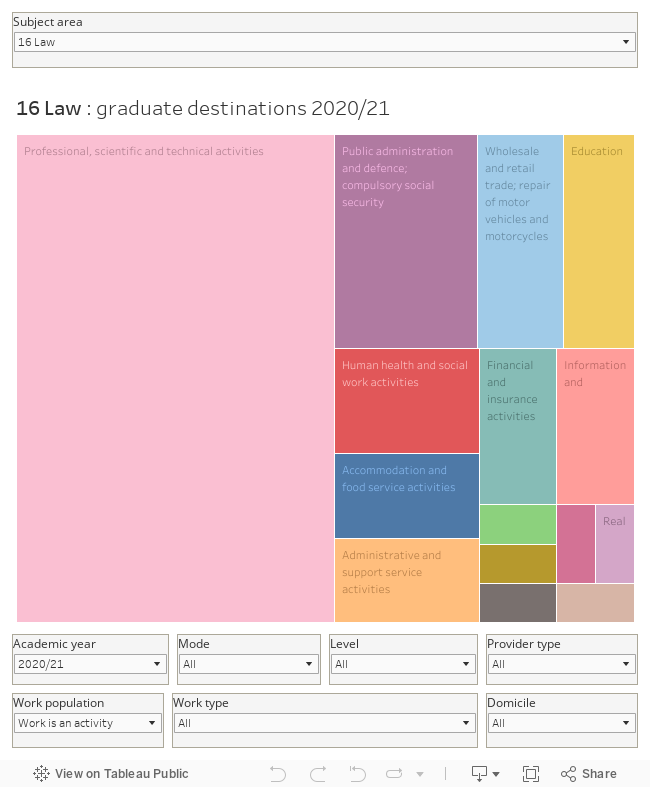
Wouldn’t it be great to have that kind of stuff by provider and subject? Maybe on whatever that Unistats replacement is called? Alas, chance would be a fine thing. Here it is by provider.
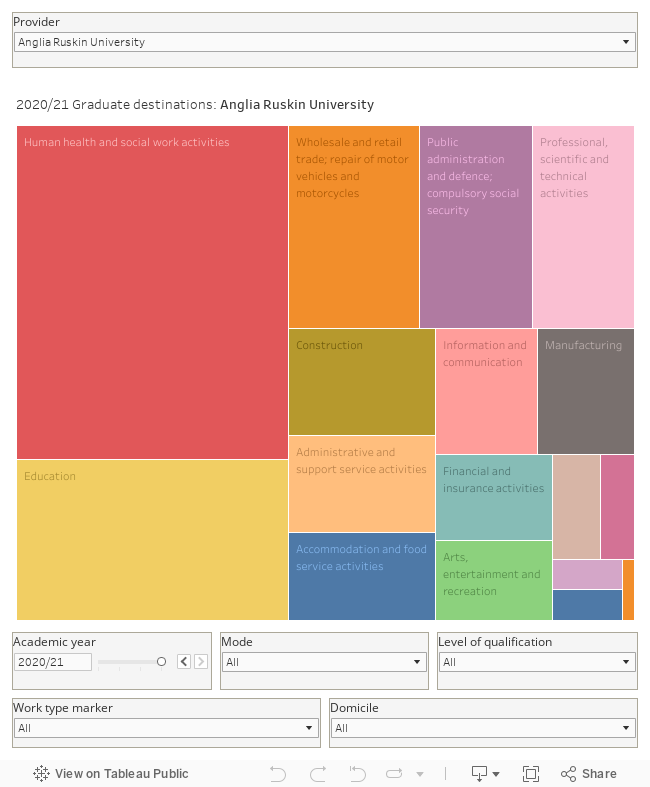
You’ll note that the filters at the bottom are not consistent with the subject ones above, and I have no idea why that is. Well, I do – but it isn’t a satisfying answer. Graduate Outcomes is still a very young data collection, and even though some regulators treat it as a source of truth we are really still figuring out what we want from it and how we use it. There’s been a whole load of changes for this year both in collection and presentation – I dare say there will be more to follow in the years to come given the shift to a data futures methodology for every year after this one..


I wonder if the relation between subject and quality of work would be different if you excluded the ‘graduate reflection’ question ‘I am utilising what I learnt during my studies in my current work?’. This would bias the results towards more vocational courses.