


Lucky us, getting Graduate Outcomes in three separate slices over the summer.
The first tranche looked at the whole sector, the second adds more analysis at this higher level but gives us some juicer stuff on individual providers. The third piece – date to be confirmed but expected to be in mid-July – will have more detailed breakdowns of things we’ve seen already, and responses to the subjective well-being questions (life satisfaction, happiness, anxiety) .
But the graph I’ve been looking forward most comes from data in this release, and sits at subject level.
Does subject of study make a difference to graduate attitudes?
There’s been a gathering policy storm over subject areas – a national conversation that draws roots back to the nineties panic about “Mickey Mouse” courses. The argument, beloved of those who prop up the bar at your local Conservative Club, is that some subjects are just not worthy of university study.
Any serious student of university history gives this immediate short shrift. Less than a hundred years ago English literature, engineering and politics were sniffed at in the senior common room, a century earlier would see few students of the hard sciences or medicine interested in entering university in England. Some subjects, nursing and education for example sat mostly outside the university sector until the eighties and nineties.
The “reflections” questions in Graduate Outcomes have resulted in data that can counter lazy assumptions about the usefulness of degree courses. Graduates are asked if they are using what they learned during their studies in their current activity, alongside questions about the meaning and career-appropriateness of what they are doing post-study.
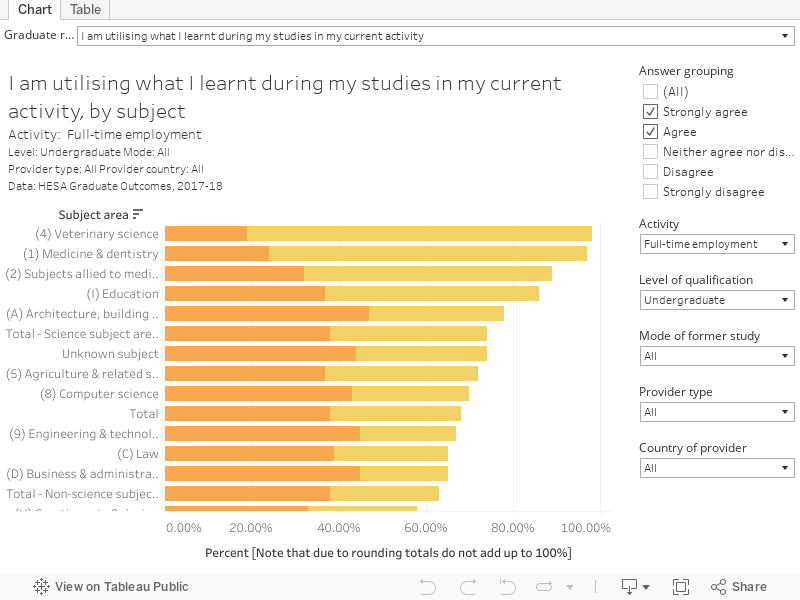
Here I’ve plotted the percentage of first degree graduates answering “agree” or “strongly agree” to whether they are using what they learned at university, based on those in full time employment – as usual you can manipulate the filters to look at other answers and activities.
The complexities of this question are worth reflecting on. We can draw a useful distinction between course-specific competencies on courses that lead to specific employment, and more general graduate skills for those who enter the main graduate job market. So, although veterinary and medical science, subjects allied to medicine, education, and architecture top the list we should consider the fact the students have been trained for a particular job they are now doing.
At the other end of the table we see history and philosophy – as studied by our current universities minister – languages, mass communications, and physics. Creative arts, which you may expect from close reading of certain newspaper columnists to be near the bottom of this list actually appears to provide graduates with more usable skills than biological sciences or maths. In all subject areas 50 per cent or more of graduates in full time employment report they are using what they learned during their studies 15 months into their working life.
For some reason, law students are more likely to report using their degree skills while unemployed, possibly in an attempt to apply for Universal Credit.
Is grade inflation a thing?
From “low quality courses” to grade inflation, we continue our tour of the contents of DfE in-trays with a look at how degree classification affects what you do afterwards. If grade inflation really is an insidious danger to the reputation of higher education, we would perhaps expect to see a levelling out of employment and further study outcomes by classification.
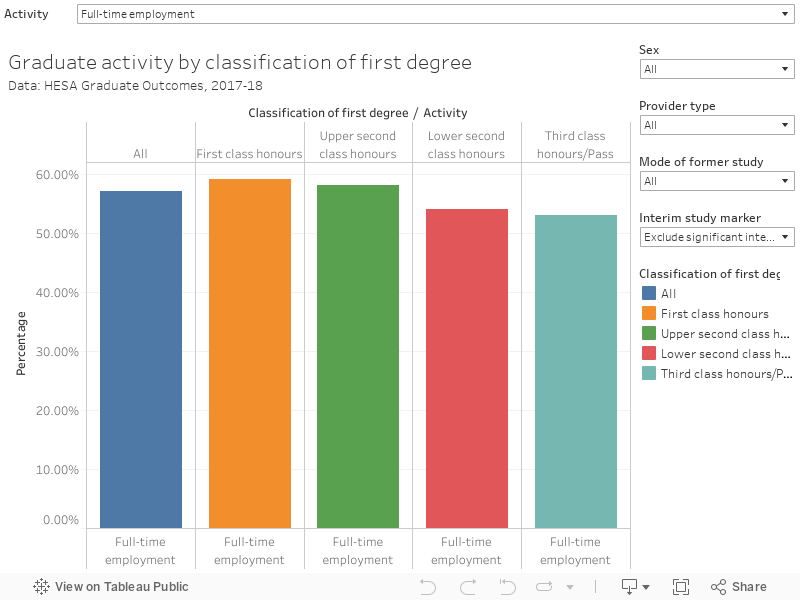
This graph shows the percentage of graduates in each activity after graduation, selectable via the filter at the top. If you look at full-time employment you see little difference between first class and upper second outcomes (59 and 58 per cent), but a sharp tailing off thereafter. Unemployment shows a more striking pattern – 7 per cent of third class degree holders reported being unemployed, compared to 2 per cent of first class degree holders. And first class graduates are far more likely (12 per cent) than their third class degree-holding former classmates (4 per cent) to enter full time further study.
For whatever reason, first class graduates do better after graduation than others. This suggests that degree classification remains a useful means of identifying graduates more likely to go on to employment or further study, and that it concurs with the judgement of employers and other providers.
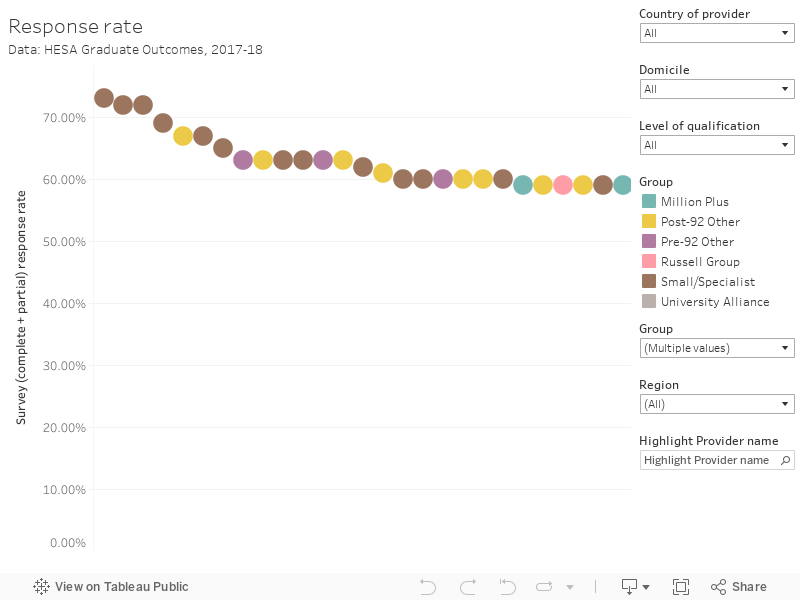
Provider level statistics: a caveat
HESA should be congratulated for prominently displaying response rates by provider – without these any provider level comparison would have little meaning. And these ones are particularly notable for being so unexpected.
I have no understanding as to why large, successful post-92 providers like Coventry and De Montfort should have lower response rates than outwardly similar providers like Sheffield Hallam and UWE Bristol. Some Russell Group providers like Edinburgh and Manchester saw low response rates, while Cambridge and Belfast were at the top end. It’s all very odd.
One thing to bear in mind is that, in the main, smaller providers were more likely to see higher response rates.
Finding meaning after graduation
Turning first to the reflective questions, I was interested to see how graduates find meaning (or otherwise) in their post-graduation experience at a provider level. Ninety-five per cent of Bishop Grosseteste graduates in full-time employment reported that they found their current activity “meaningful”, compared to 69 per cent at Falmouth University.
If we are interested in graduate wellbeing, it could be argued that this is the most valuable measure of outcomes. Unlike salary, it ties in ideas of personal fulfillment – poorly-paid artists, social workers, and lab technicians may be hugely content in what they are doing, well-paid investment banking “quants” may not.
Likewise all graduates from Bath Spa and West London who went into full-time graduate study reported it as meaningful – a continued joy in learning is not something to be sniffed at after three years of intense study.

In terms of using what has been learned during study, only 48 per cent of Plymouth College of Arts graduates in full time employment reported that they were doing so. This does not compare well with 93 per cent of Royal College of Music graduates in employment, though I would caution that these datasets should include numbers as well as percentages as small cohorts are more likely to be outliers in proportional terms.
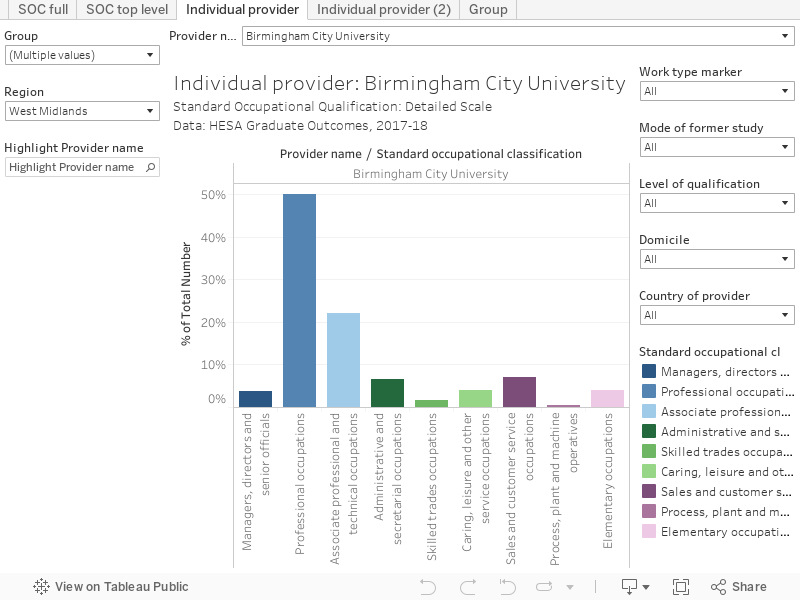
Graduate jobs, by provider
All this talk of finding meaning and fulfilment is unlikely to reflect other coverage, which will focus on the types of occupations graduates go into. I went over some of the concerns about SOC in my last analysis of Graduate Outcomes, and as noted in the comments we are awaiting a newer and more HE focused iteration that will answer some of these worries.
Data on SOC by provider is rather cleverly designed so as to make it difficult to present any kind of league table, perhaps to avoid irresponsible people doing what I have done in the graph below for graduates from full-time undergraduate courses in paid employment.
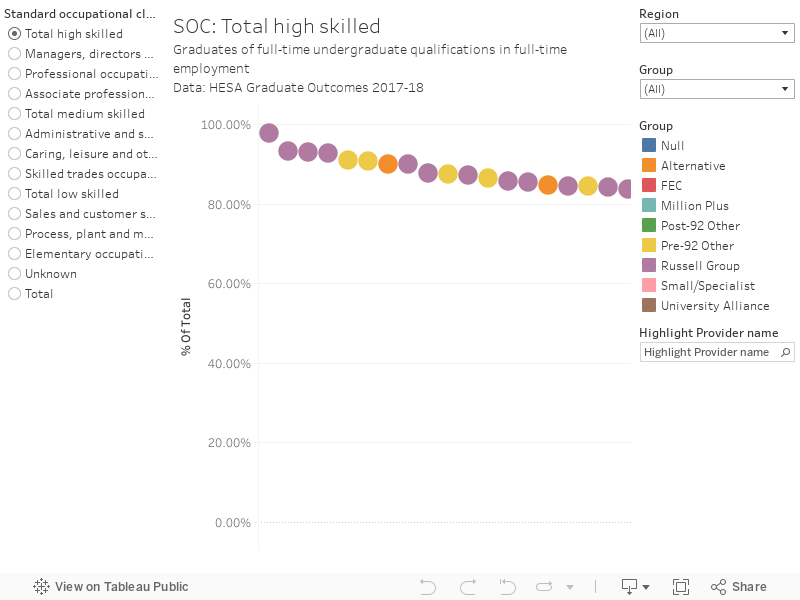
For providers with 50 or more graduates in this category, this shakes out as follows. Nearly 83 per cent of Imperial College graduates were in professional occupations, compared to 4.35 per cent at the Plymouth College of Art. 14.29 per cent of graduates from Harper Adams reported being in manager or director roles, compared to 0.81 per cent at the University of East Anglia. Overall, Imperial top the “high skills” table, with 97.76 per cent, London Churchill College is at the other end with 7.69 per cent – albeit of only 65 graduates.
There is a lot of data in here and we need to be careful how we use it. I’ve built a more comprehensive tool to get deeper into provider figures which should give you an indication of the range of what is available.


If ‘GO’ is not to be countenanced, may I propose ‘GrOut’?
Given the appropriateness of your comments about creating league tables using data in the form provided. I’ve been enjoying the spurious and selective nature of claims being made by various HEIs in the last week. I’ve lost count of the number of Top 10 Universities.
A world beating 89% of all providers are in the top 10