


One point four billion pounds is, however you slice it, a lot of money.
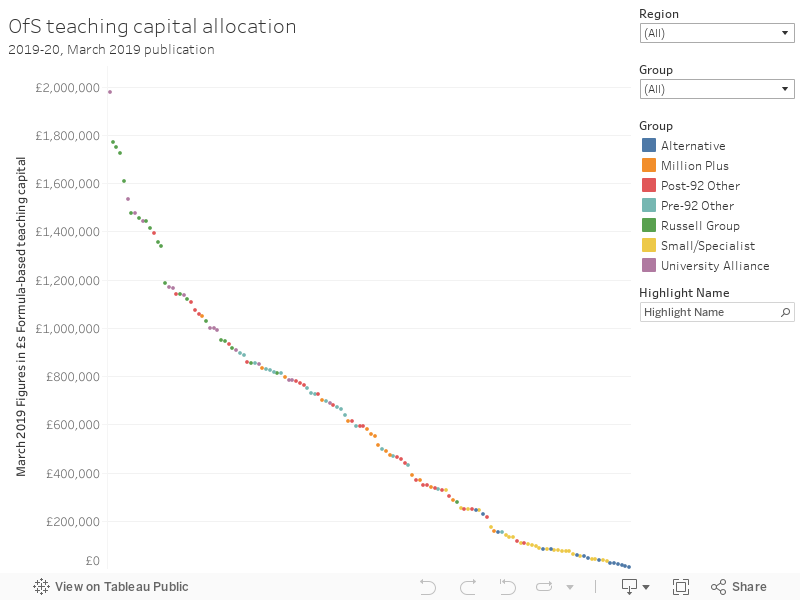
And slice it is just what the Office for Students has done – allocating £713m for high-cost subjects, £337m to support equality of opportunity, £40m for national initiatives and facilities, and £100m of capital.
We get a few ideas as to how that pans out for providers – high-cost funding will rise but will have to cover more students, and there are more providers who may potentially split the pot. We know the capital allocations:
But we are overdue a proper systematic look at institutional finances – so we don’t know how this announcement will have an impact on English HEIs, and how this compares with the status of those in Scotland, Wales, and Northern Ireland. And – not least – we need to be ready for Augar and what that may bring for the whole UK.
OfS’s new regulatory duty to assess financial health for the minister means that the next instalment of financial health analysis will likely be wider in scope – the release of last month’s HESA finance data suggests that it will have more depth than its equivalent publication in past years- HEFCE’s own “Financial health of the higher education sector”.
But there’s been no sign of it. On Friday we learned that “The OfS will shortly be publishing its first report on the financial health of the sector”. But as we’re still waiting for it, we built our own.
The financial health of the sector (HEFCE 2019/01)
A starting caveat – these visualisations have been built using open data as published by HESA. Rounding has occurred, and as this is data new to the scrutiny of open publication there may be issues with data quality. So you should take these graphs as indicative rather than absolute, and query unexpected findings with HESA or the person that submitted your HESA return.
Previous HEFCE reports used the Key Financial Indicators (as we summarised last week) to lead in to a more detailed analysis of specific aspects, often displayed as proportions of income rather than in absolute terms. And previous HEFCE reports looked at English providers only – I’ve been able to go UK wide.
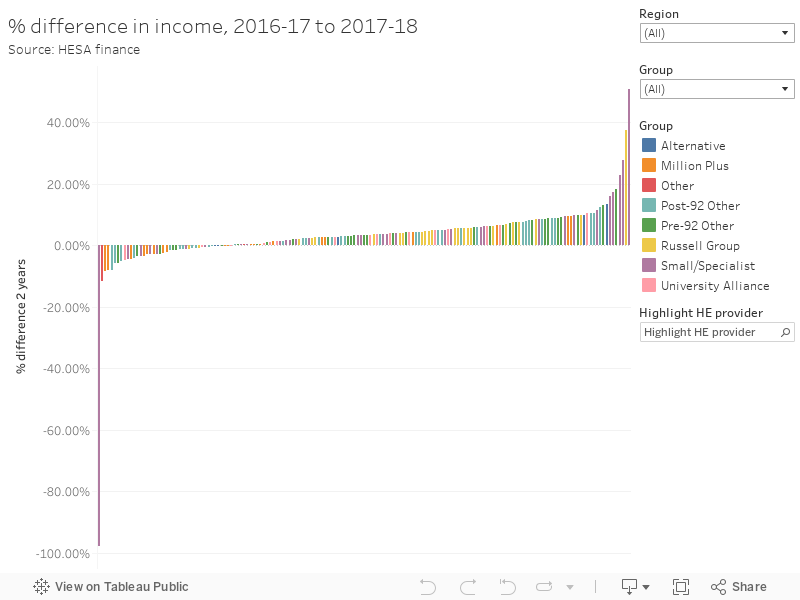
Percentage change in total income 2016-17 to 2017-18
For example, the 2018 HEFCE publication analyses real-terms percentage changes in total income over two years. I’ve here calculated just the basic percentage change by institution for all providers in the dataset. The average change is 3.4%, but there are some significant outliers. Heythrop College was in a wind-down process at the time – Stranmillis may represent a data issue as I’m not seeing the figures replicated in their annual financial statement. For many of the following graphs I’ve omitted significant outliers with a filter for ease of viewing – you can easily use the sliders to add these back in if they are of interest.
One surprise from this graph (and the staff costs one) has been the University of Oxford. I’ve since heard that 2017/18 was the first year Oxford University Press was included in the main university accounts – explaining nearly £800m of the increase in income.
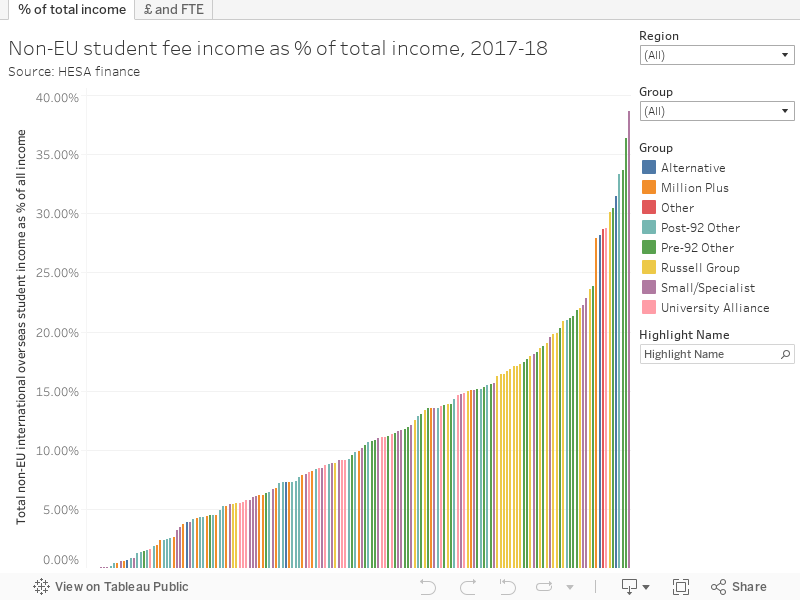
Overseas fees as percentage of total income
Income from (non-EU) international students continues to play a significant part in institutional finances. As the OfS does not control the size and shape of the market, and thus the “unit of resource” for high-cost subjects will vary wildly year-on-year (as OfS pointed out when announcing 2019-20 allocations), there is an increasing need to consolidate this income stream.
On average, 11% of all income comes from non-EU student fees (I’m excluding international education contracts here as a separate market). There are no obvious outliers here, but the range of contribution is instructive – many providers see no income from this source, but two (Heriot-Watt and the Royal College of Art) gain more than 35% of their income from international students.
The other tab on this graph shows the amount of income, and we can see the clear dominance of the Russell Group. The small black lines represent non-EU student FTEs – they rise broadly in line with income – large differences in this pattern likely show an institution either recruiting less postgraduates (who tend to pay more for their courses) or charging lower fees overall.
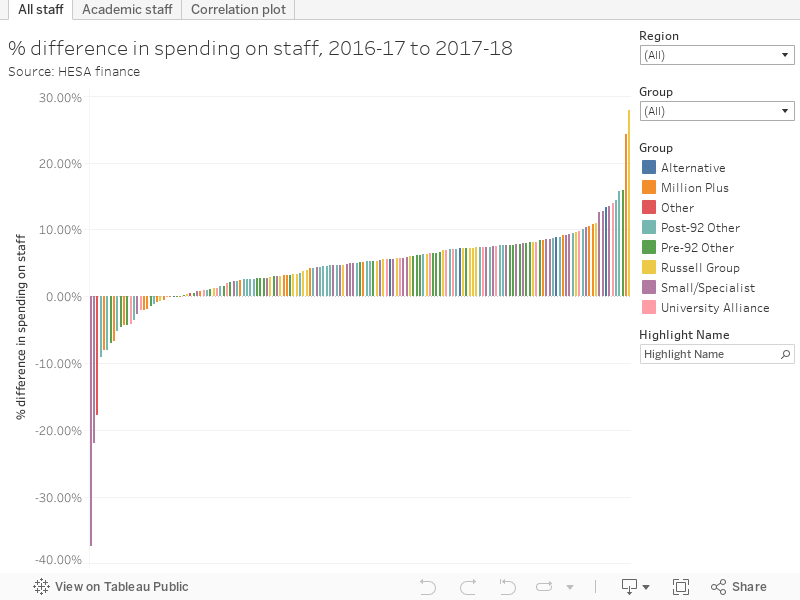
Percentage changes in staff costs, 2016-17 to 2017-18
Any provider looking to reduce expenditure would likely look to reduce the number of salaries paid or pay lower salaries – personnel represent the largest recurrent cost for any institution in the HE sector. Average values show a largely static picture (4% for all staff, 2.8% for academic staff) but this is countered by a huge range in variability. Plymouth Marjon, Cardiff Metropolitan, East London, and Buckinghamshire New Universities have seen significant cuts, whereas Oxford and UHI show the largest increase. In most providers spending has increased slightly.
Looking only at academic staff (on the second tab) shows Plymouth Marjon, Rose Bruford, and Kingston making large reductions – UHI, the Royal College of Art, and Birmingham have increased their spending on academic staff by more than 15%. I’ve also plotted the change in spending on academic staff against the change in spending on all staff on the third tab – fans of Wonkhe’s podcast will be delighted to see a medium correlation between the two, hopefully putting lie to the maddeningly persistent idea that the sector is recalibrating towards supporting more non-academic roles.
Surplus and deficit, 2017-18
I’ve plotted a proportional look at surpluses and deficits (from income and expenditure statements) in two ways – firstly against the balance of the provider at year-end, and secondly against the comprehensive income from that year. I’ve done the second mainly for comparability with the HEFCE releases – to me comparing with balances shows some very unusual patterns worthy of remark.
I’d love to know more about what is happening at UHI – I’ve not been able to track down a 17-18 financial statement. Clearly investment in new facilities and capacities continue at pace for one of the UK’s more unique universities, but seemingly this is taking a toll financially. We were assured for 16/17 that “the key fundamentals of a good business are still in place”.
Among larger HEIs Bournemouth and Warwick are making a healthy profit based on these figures, smaller specialist institutions like Guildhall, LSHTM and SRUC are also performing well. The sector average, however, is 0.01% – way below inflation.

External borrowing, 2017-18
In 2018 HEFCE predicted external borrowing in the English sector would sit at around £10.7bn this year, and they got this almost exactly right.
The idea of universities borrowing money seems to scare everyone witless – a sectoral quirk we looked at on the site a few weeks ago. It is indeed the case that providers borrow to invest – and some borrow more than their balance to do so. The sector average is around 30% of institutional balance, but a fair number reported no borrowing at all.
Conversely, this data shows five institutions borrowing more than 100% of their balance – Roehampton, Heriot-Watt, Suffolk, Anglia Ruskin, and Bournemouth. This does not make these institutions a concern – lenders would simply not lend to institutions that showed any sign of being unable to repay. You could see this more as an indicator that many of these institutions will be investing in key infrastructure, and thus may have less flexibility in their annual budget for the next few years.
I’ve plotted loans due in 1 year or less against income on the other tab – again for consistency with the HEFCE document. The negative values show institutions with negative income, the high values at the other end suggest that other means other than repayment from a surplus on running costs will be used to settle these debts. In the latter case refinancing, or the use of reserves, may be the plan.
The more eagle-eyed readers will have spotted that finance from bonds does not show up here, and that I’ve filtered out the borrowing Northampton has done to spend on a new campus (which I feel is best seen alongside these bonds).

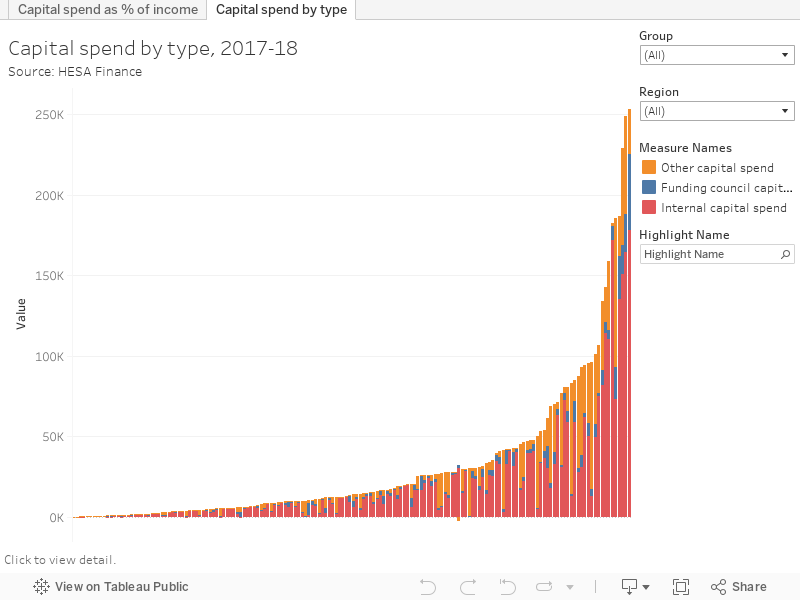
Capital expenditure and source, 2017-18
Borrowing usually supports capital expenditure – and is shown in orange on the stacked bars in this visualisation. You can click on each bar to show the detail. Because there are less funding council grants about (blue), providers increasingly turn to external borrowing to support developments in infrastructure.
OfS announced £100m in capital grants for next year, which sounds great until you realise that the total capital spend in England was around £4bn last year, with only £388m of that coming from funding councils (OfS and the research councils).
UCL, Cambridge and Manchester were the big capital spenders – in each case most of the money came from their own internal reserves. Imperial and Edinburgh come next – with the latter relying more heavily on “other” sources – likely to mean borrowing or sale of assets in most cases – which means here a loan from the funding council. As a proportion of income Chichester and Royal Holloway are the big investors.


@DK, I don’t think £713 will do much for high-cost subjects! 😉
Ha – £713m isn’t much better…
If you believe the figures, about half of the sector has a surplus below inflation and around a quarter is operating at a level either no different to or significantly below zero.
HEIs have very significant fixed costs: a salary bill, buildings to maintain, and in many cases debts to service. There are few economies of scale and in fact HEI operations are becoming more not less complex over time. A multiplicity of business models for different types of students/stakeholders has also pushed up administrative overhead. Critics of the latter still tend to think in terms of how universities used to be but the fact is complexity of any sort needs managing.
Mendelssohn wrote a piece of music titled “Calm Sea and Prosperous Voyage”. Mussorgsky one called “Night on the Bare Mountain”. The latter may be more appropriate mood music unless you have a very optimistic disposition.