


On the one hand we have the government wringing its hands over the growth in first class degree awards. On the other, we see an appetite to tackle “low quality” courses that don’t lead to a salary premium later in life.
There’s been surprisingly little research into the intersection of these two issues – what, if anything, is the salary implication of a first rather than an upper (or lower) second?
From Longitudinal Educational Outcomes (LEO) data we know that HE provider, subject of study, prior attainment, sex, and region of graduate employment all have an impact on salary. What LEO doesn’t tell us is anything about the impact of actual outcomes.
An unexpected split
Today HESA and the University of Warwick have identified that there is a clear difference in salary outcomes based on degree classifications – and the gap appears to be widening.
As with previous HESA research, we’re looking at two distinct cohorts – one comprising those born around 1970, the other including those born around 1990. This allows us to take a perspective on the way the graduate job market is changing over time – the earlier research suggested that the graduate premium on a lifetime of earnings had fallen from 19 per cent to eleven per cent in the 20 years between these two groups.
For graduates with a first or upper second class degree the premium has dropped from 20 per cent to 14 per cent over that same period – but the premium for a lower second class degree has fallen from 14 per cent to a staggeringly low 3 per cent.
There’s also a tentative look at differences within those splits – there’s some evidence of a fall of up to three per cent in the return to a first class degree relative to an upper second, and the return of an upper second relative to a lower second or below has increased by three to eight percentage points. This analysis takes into account sex, ethnicity, disability, and job tenure across both datasets (the British Cohort Study, and the Next Steps datasets). The headline findings also consider prior attainment, school type, background, even non-cognitive skills and health. Such are the benefits of cohort study data – the drawbacks are that it is a sample rather than a population.
Why, though?
The report suggests that:
This divergence in the return to a degree by broad classification of award appears to be the result of the changing return to an upper second class degree relative to a lower second class degree or below.”
The growing numbers of graduates in the job market mean that larger employers are needing to pre-sift applicants – by chance or by custom this appears to have solidified the “upper second or above” bar that has been a consistent feature of employer graduate scheme entry since at least back when I was applying for them. We don’t, of course, get to see salary data for the more recent 10 years where the proportion of graduates achieving a first class degree rose from 8 percent to 28 percent – or any impact on the behavior of employers in response to this (anecdotally a retreat from using degree classifications at all). However, as the report notes:
The Institute of Student Employers noted that the proportion of employers requesting applicants to possess at least an upper second class degree rose from 52 per cent in 2004 to 76 per cent in 2012.”
So perhaps the degree classification is not quite finished yet.
There’s also a suggestion that growth in pay has been stronger in non-professional and professional jobs – the introduction and progressive uprating of a national minimum wage being one cause of this. But we also need to think about – in market signalling terms – how a first class degree may not now be the differentiatior it once was, even if “first or upper second” continues to have a role to play.
A moral hazard?
This has fascinating policy implications. Imagine, for example, you are seated at a desk at the Department for Education in Sheffield working on measures to address grade inflation. One measure you may consider is requiring that providers use norm-referenced grading (or grading to a curve) to produce a static percentage of firsts and so on for each provider. This addresses “grade inflation” by assuming that only the top, say, ten per cent of each year should be awarded a first, and the next 20 per cent should get an upper second, the 30 per cent after that should get a lower second, and so on.
This becomes immensely problematic when you have clear evidence of an upper/lower second cliff edge on later earning potential. You’d be potentially consigning two graduates with the same scores in two different years to vastly different careers, just because of the slightly stronger performance of their peers. Even though OfS probably reckons it can get around the institutional autonomy issue – there’s a risk of legal action from unlucky students and possible judicial review.
Of course, the graduate job market may adapt to such norms over time, but it does feel like a little bit of a gamble.
A peak by provider
All this got me wondering whether there was a relationship between degree classification and earnings that I could see more recently. I took data by provider from LEO on the 2014-15 graduating cohort, and merged with HESA data on first degree classifications awarded to the same group. There’s so much I’ve not controlled for it’s embarrassing – but for a quick look at earnings one year on I feel like this is at least indicative.
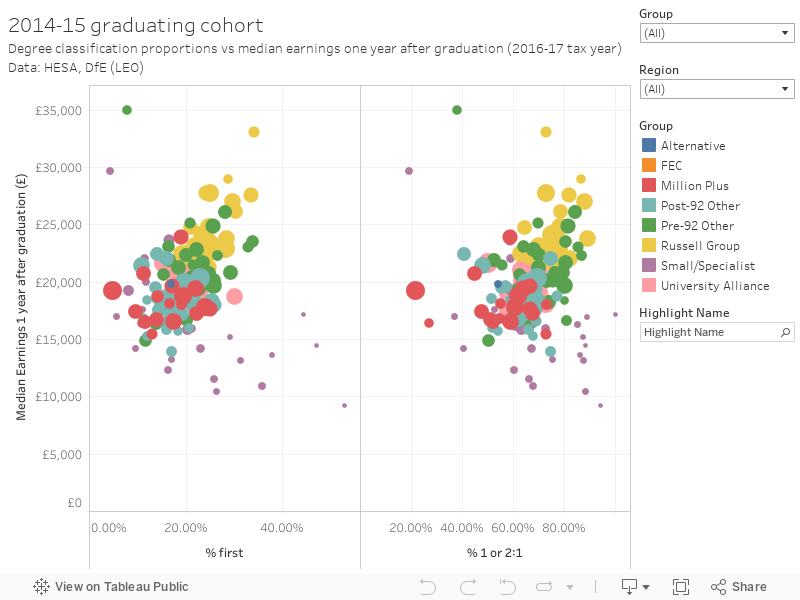
But indicative of not very much. There’s no statistical relationship between classifications and earnings by provider, though you can eyeball the beginnings of a positive relationship to the extent that it makes me think that IFS could do something interesting with all their lovely data. The relationship with the percentage of first class degrees is on the left, and with firsts and upper seconds on the right.
What really sticks out is comparatively generous marking in the Russell Group – with a couple of members nudging 90 per cent of graduates with firsts or upper seconds. This doesn’t appear to be impeding earning capabilities in any way.


I’m sceptical about the usefulness of this given the lack of subject benchmarking, particularly for large scale vocational subjects in the first cohort (born in 1970).
The changing proportions of graduates in disciplines like medicine, teacher education, law and especially nursing/midwifery (which barely existed as honours degree subjects for the first cohort) are bound to have an effect at the macro level and need adjusting for – difficult in a small sample.
Also at the time of the first cohort, many people still moved into higher earning disciplines not by taking a ‘university’ degree but through professional examinations (Accountancy being a notable example). They may have had say a 2:2 in humanities from a traditional university at the time but if they took the professional exams of the Chartered Accountants afterwards they could probably double their salary over time.
It is also well known that some subjects have different proportions of Firsts not reflected in salary levels – Art & Design being a notable example.
The researchers also say they used the 1991 Universities Statistical Record (USR) as a benchmark for the validity of the sample!! The final paragraph of page 7 is a classic of ignorance of the history of data collection in the sector. Did no-one tell them that the majority of UK graduates in 1991 were not in the USR? They were still in FESR/FDS – the student returns for the then ‘public sector’ institutions, ie then Polytechnics and 100s of other institutions, that constituted the majority of the student numbers in the sector mostly unified in 1992 and in data terms in 1994. The final sentence referring to dropping out of “university” (in the period 1988-91!) is a classic error!
The difference between full time and part time graduates in the first cohort would have also been dramatic, as many in the non-USR sector in the 1970 cohort were already in employment – for example I recall that the Construction subject group still had large numbers of part time graduates in the non-University sector, taking ‘day release’ courses for professional accreditation (now sadly gone), three polytechnics I worked on the data returns for in late 1980s/early 1990s had masses of these students. The non-USR graduate cohort in 1992 would have also included the vast majority of full time graduates in some disciplines, for example Art & Design, an outlier discipline mentioned above.
Some of the historical assumptions in this report need careful unpicking if we are to get a full and accurate picture.