

HESA Spring 2022: Business and Community Interaction data
David Kernohan is Deputy Editor of Wonkhe
Tags
The Business and Community Interaction (BCI) dataset is these days best known as the power behind the Knowledge Exchange Framework (KEF).
It also offers a window into activities that support the civic mission of universities and colleges, but it is likely that most attention will be paid to the measures that deal directly with the economic and innovation impact of universities.
Today’s release updates the collection to include data from 2020-21, the first of two years affected by Covid-19 related restrictions – providers got an extra three months to make this return. It omits some of the qualitative data on university strategies familiar from previous years, as collection of this was suspended for 2020-21. With so much of this information now captured by KEF, I would be surprised to see these requirements return.
University start ups
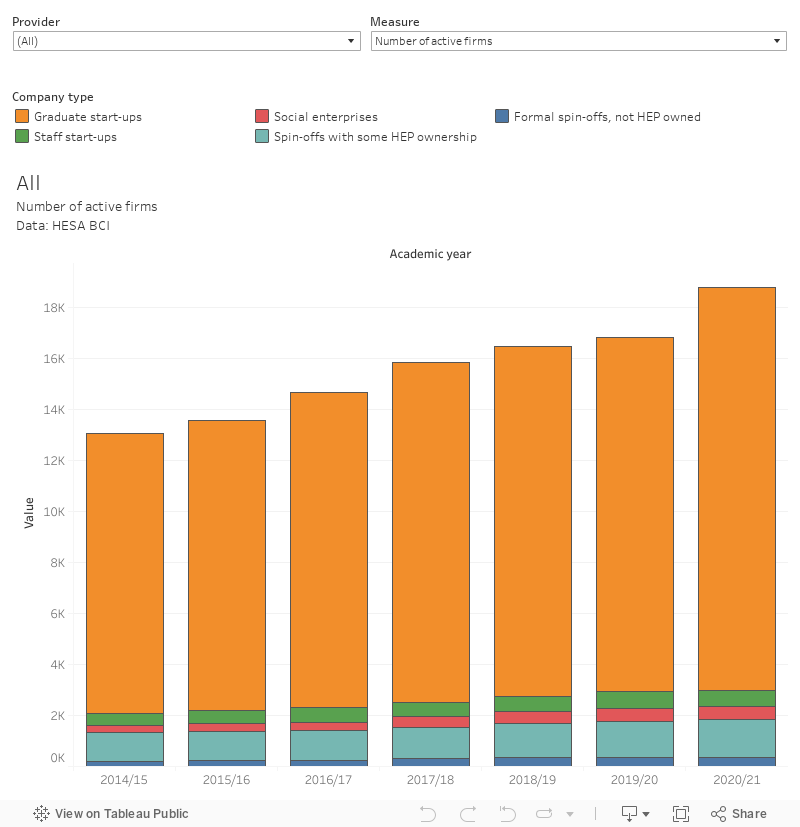
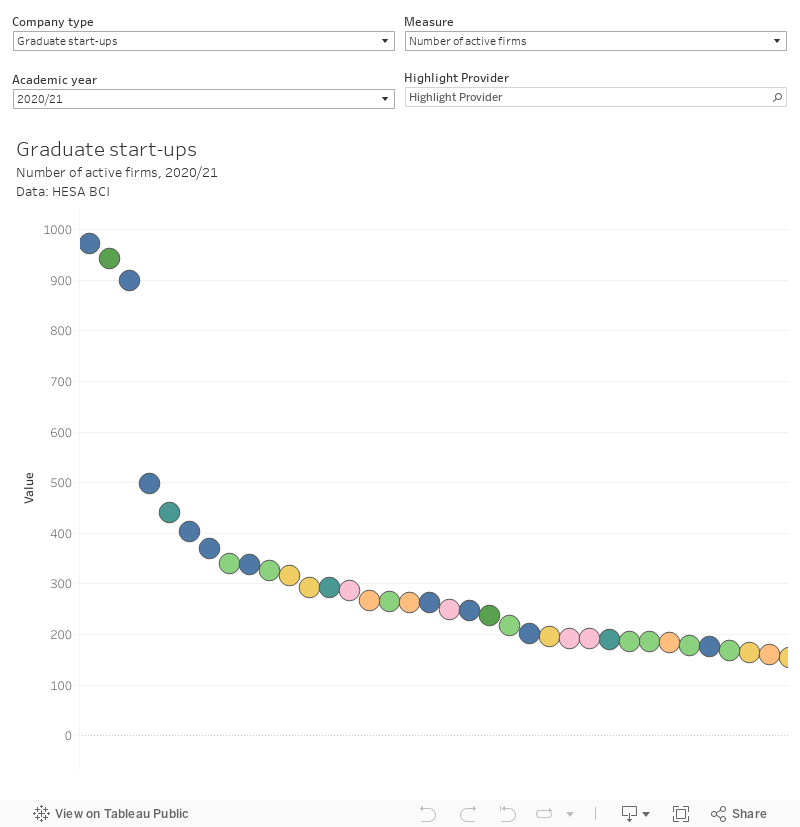
The total number of university-linked start ups continues to grow, mostly driven by a significant increase in graduate start ups. In 2020-21 there were 15,793 of these – employing 46,723 people and with a total turnover of £3,300m. Indeed, a record annual number of graduate start-ups – 4,528 – were registered in 2020-21. Kingston, Central Lancashire, and the University of Wales Trinity St David have been particularly successful in seeing
But turnover is dominated by formal university spin-offs that are not owned by providers – this reached £6,781m in 2020-21, vastly above previous years and most likely (though we don’t see this from the data) due to healthcare related and pharmaceutical industries. We do know that this turnover is linked overwhelmingly to the University of Cambridge.
Here I have plotted this data as a time series – allowing you to look at the contribution of each company type over time to your chosen measure. You can view the data on a sector-wide basis (default) or look at an individual provider.
I’ve also done a version allowing you to rank providers on the various measures as they relate to each company type and academic year. I’m not a fan of rankings in general (as regular readers will know), but this does help you to see where particular providers are making a significant contribution to UK-wide performance.
The overall message I’d take away here is a mixed one – it is clear and laudable that universities are getting better at supporting start ups led by graduates, but how much of this growth is due to better support and how much is due to better data quality is not clear. Certainly other types of start up (notably staff-led initiatives) fell during 2020-21, which is closer to what I would have expected.
Civic events
The lecture, the performance, the museum, the art show. All mainstays of the university “offer” locally (and nationally) and all very likely to have migrated online during Covid-19 restrictions. Is that what we saw?
For paid events, we can identify sharp falls in attendance and staff time between 2019-20 and 2020-21, all commensurate with a move away from traditional provision. But for free events the “other” category continues to dominate – though at a level far below that of previous years. HESA defines “other” events as including:
viewing and listening figures for television and radio programmes produced by HE providers, and downloads from their websites
A category unsurprisingly dominated by the Open University.
However, this masks a striking increase in attendance at free public lectures – and a corresponding rise in staff participation. Both these suggest that the public lecture saw a new lease of life as an online alternative to the box set or zoom quiz. Cambridge dominated in this category in 2020-21.
Here I’ve plotted a provider level time series in a similar way to above.

It turns out online lectures are pretty popular – but less so when people are paying for them.