


You wouldn’t think it from the coverage in The Telegraph, but the recent release of data comparing the attitudes of the general public with students’ propensity to “ban” speakers actually contains some interesting stuff.
Where is the data from?
We’re looking at YouGov Omnibus Targeted Research, which makes use of a pre-screened online panel to deliver a representative sample of the population based on the requirements of the client. YouGov asks members of the panel to complete an online survey, and then uses the characteristics of those who responded to it to construct a properly weighted and representative sample.
In this case, there are two surveys – one representing students in the UK (n=1004) and one representing the UK population generally (n=1636). These samples are selected and weighted by voting record, sex, and age – with the student one also by institutional type, loan status, predicted grade, and year of study; and the UK one by EU referendum vote, social grade, and region.
We should note that there is no attempt to match the two samples by age, region, or social class – so this is not, entirely, a like-with-like comparison.
If outfits like YouGov are good at one thing, they are good at choosing representative samples. We usually see this in their voting intention surveys – which have been purchased by a newspaper or other client in order to generate or continue a story. That’s not to say YouGov will bias a survey or sample to suit a defined agenda – they are British Polling Council members, after all. In this case we can get a sense of what YouGov were after by looking at the design of the survey.
What else is in there?
The student one, in particular, is interesting in terms of what is asked. There are a bunch of questions on HE funding policy – both how well the current system is understood, and preferences for changes. There’s a set of questions on how well students understand the way institutions are managed, and also questions on general satisfaction and expectations of their life post-graduation.
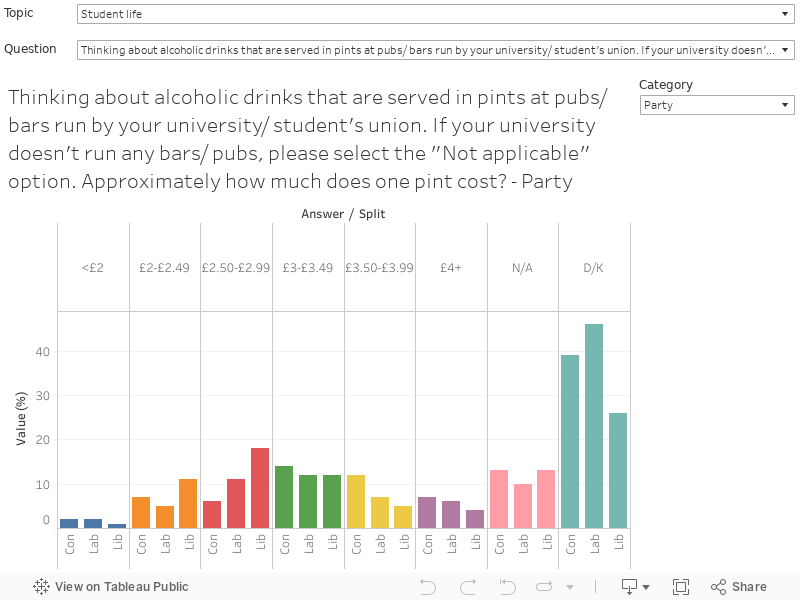
We get questions on weekly contact hours, and also how many hours students generally miss. And there’s also a particularly odd set of questions about alcohol. I’ve omitted these from my visualisation save for one on the price of beer in university bars – that’s only there because it tells us how rarely students (other than Liberal Democrat voters, for some reason) drink in institutionally-run bars.
Delightfully, the data is released as particularly poorly formatted PDF files. What follows is a glimpse into another universe, where private polling companies present data in more open and usable formats.
So – already we see an agenda building which is depressingly familiar from the last year of HE press coverage – universities are awful (expensive, difficult to understand, not giving students what they want) and students are awful too (not turning up to lectures, not understanding policy or their institutions, drinking subsidised beer and demanding taxpayer handouts).
Snowflakes, too
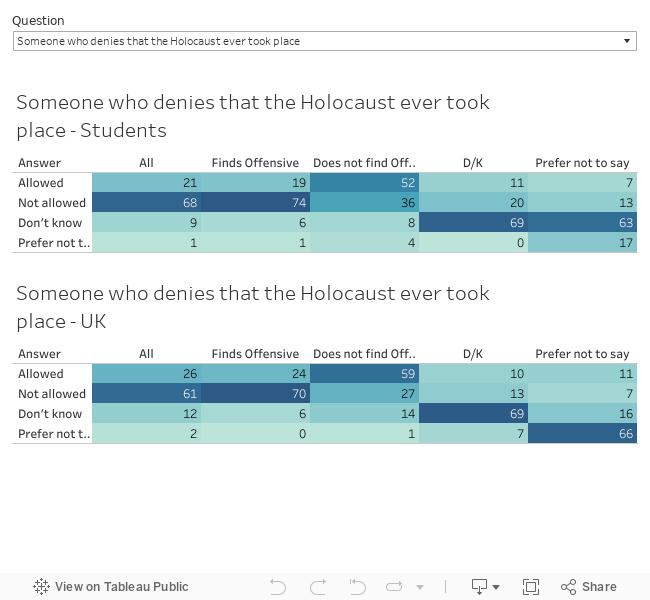
The stuff that is really exciting to a certain group of editors is the “no platform” questions. These are the only ones that are repeated in the UK sample (a shame, as save for the the Civic University Commission’s recent survey with YouGov there is precious little out there on how universities are perceived by the general public). And these questions are the only ones to feature as both a question and a dimension in both surveys.
What I mean by this is that there are actually two questions asked on each topic – one concerning how personally offended a respondent is by particular opinions, and one concerning whether a speaker with such an opinion should be permitted to speak at a university.
This is the text of the latter question from both surveys:
For the following question, please imagine that each of the following types of people had been invited to give a speech at your university. Do you think the speech should be allowed to go ahead or not?
There is an issue immediately apparent. The general public sample is being asked about their university – and they do not (as far as I can see) have any guidance on how to know what this would mean. Is it their own, imaginary, university? A university they may have studied at (though there’s no weighting for graduates and non-graduates)? A university they are aware of through family or friends?
A better test
Evelyn Beatrice Hall used a famous phrase to describe Voltaire’s conceptualisation of free speech; “I disapprove of what you say, but I will defend to the death your right to say it”. It is trotted out as free speech best practice – allowing a person to speak even though what they say may be abhorrent.
As our surveys tells us how many of each sample are offended by a statement, and this is cross-tabulated with whether they want to ban it on campus, we can both test the existence of this attitude, and compare attitudes across the two samples. Both The Telegraph and YouGov’s own release just use the raw percentage of the total sample to compare the two populations.
What can we see?
Unfortunately, the first thing I can see is a poor comparison between samples. It seems to me reasonable to think that certain opinions will be considered offensive by people from a particular background, belief, region or age – but not by others. There’s no accounting made for this. The UK sample is balanced by region and age, and includes a mapping between recorded offence and these attributes. But the student sample has no region balance, and the age categories do not match up.
So when comparing one entire sample with another, it is fair to argue that differences may be linked to these attributes rather than student status.
But what we can look for in the tables are:
- Instances where people are personally offended by something but content for a speech to go ahead (the Evelyn Beatrice Hall conception of free speech).
- Instances where people are not personally offended by something, but are not content for a speech to go ahead (which would be evidence of – depending on your own personal position – the chilling effects of political correctness gone mad, or people being considerate of others).
- High “prefer not to say” values, which could also be evidence of chilling and/or decency and consideration.
For an issue like trans rights, slightly more students would choose to ban a speaker than not – and more students would find an anti-trans position offensive. But this makes more sense seen as an age variable, the recent (and hugely welcome) explosion of trans activism and allyship started as a phenomenon among young people (as with many socially progressive movements). However, the proportions of people who do not report that the issue offends them and would allow the speaker a platform is broadly similar on both samples.
For the justification of terrorism we see broadly similar values from both samples. Most see the opinion as an offensive one, and most would not allow the speaker a platform. But one interesting divergence is that most students who do not find such opinions offensive would not allow a talk to go ahead, but most UK residents with similar opinions would. Perhaps the students are being mindful of the Prevent requirements?
On a scientific controversy like evidence for a vaccination-autism link, the majority of the student sample find the opinion that there is a link offensive, but the UK sample is more evenly split. In both cases those who find the idea offensive would tend to ban the speaker and those who see no offence would not. But overall the UK population would allow the speaker, and students would ban them.
That last one worries me a little – this, after all, is a question of science, and – even though there is a medical risk linked to seeing the opinion as fact and acting accordingly – a university should really be a place where people learn to weigh up the scientific validity of a claim. For me, this is a matter of evidence and methodology, not offence.
It’s a bit more complicated than that
We’re not looking at huge differences in this data, and issues with comparing the two samples mean that we can’t rely too much on what we find – the sample comparison issue is also the reason that I’ve not run any significance tests.
But, any data is interesting, and this glimpse into how students and the general population respond to controversial opinions is worth investigating, as is how such things are reported and the influence they have on the public.
Update: Since publication YouGov have contacted us to confirm both surveys were conducted by YouGov on their own behalf, rather than at the request of an external customer. We are happy to put the record straight, and references to a purchaser in the text have been removed.


Thanks, this is a really interesting analysis. In some ways I think the differences might just come down to age differences between the student population and the wider population. Young people (…I’m generalising but I have been a young person, a student, a teacher and a parent of young people and students…) are more fixed in their views, less tolerant of opposing opinion, and sometimes have trouble understand confirmation bias and seeing the long term big picture. Young people tend to be more left wing and I have found (… generalising again but I have been, and know people who are, left wing, right wing, and all things in between…) left wingers to be less tolerant of opposing opinion, so more likely to ‘no platform’. The issue of ‘offence’ is interesting. Its not ‘offensive’ that certain people might say there is a link between vaccination and autism. Its just, by all available evidence, wrong. I’m offended by lots of things; but that’s my problem, so what? Whether I find it offensive or not is neither here nor there when is comes to allowing other people to speak about opinions they hold.