Whenever I talk to people about the growing demand for (and where facilitated growing take up of) assignment extensions and the self-certification of extenuating circumstances or health issues, I hear a surprising range of theories as to the cause.
Some put it down to the mental health crisis, others argue it’s about deadlines not being properly spaced, and some attribute it to students struggling with the language, or not having the talent or work ethic of students in the past.
Not nearly enough seem interested in interrogating the time question.
Don’t put your head on my shoulder
Back in 2020’s summer of Covid prep, it became increasingly clear that the working groups and Gold Command teams were spending almost all their time on “provision” – failing to think through the conditions that the sector was enrolling students into for independent study, let alone all the other aspects of their week that were going to be spent alone and/or online.
It was, I think, a symptom a wider problem – a sector, regulator and government that endlessly surveys students on what is staged, but barely knows what its students think of the support and facilities on offer around the edges, flailing and failing to understand the wider life contexts into which all of that fits.
A critical issue in those contexts is time. It’s telling, I think, that while the Office for Students’ Equality of Opportunity Risk Register mentions “Time” in the context of cost pressures (“Increasing costs of living… may result in an increasing number of students undertaking part-time or full-time employment… less time to study”) it doesn’t really pick it up anywhere else.
Some surveys offer clues. The HEPI/Advance HE Student Academic Experience Survey also mentions time constraints caused by working as well as studying – noting a record number of students in paid employment (55 per cent), a record average hours spent in employment (7.5, up from 4.8 in 2019 and 13.5 for those that do have a job) and other proxies for time poverty like the growing percentage of students with caring responsibilities or living a long way from campus.
It’s nevertheless notable that there seems to be a direct correlation between the number of students in paid work and POLAR quintiles – and really quite remarkable that just over 4 in 10 students now live more than 5 miles from campus, up to over 6 in 10 for those living at home.
Of course, the SAES only looks at full-time undergraduates, and the figures above also seem less worrying to some when the number of timetabled hours is a record 16.0 (up from 13.9 in 2019) – even if independent study “represents one of its lowest proportions in recent times”. And it doesn’t really give us a sense of the overall picture of how students are spending their week.
Neither the Postgraduate Taught Experience Survey (PTES) nor its PGR sibling offer much intel (other than a question on the former on whether the timetable fits well with other commitments), and the UK Engagement Survey (UKES) tends to deal in frustrating and incomplete percentages for Taught study, Independent study, paid employment and extra curriculars.
This could be the best place yet
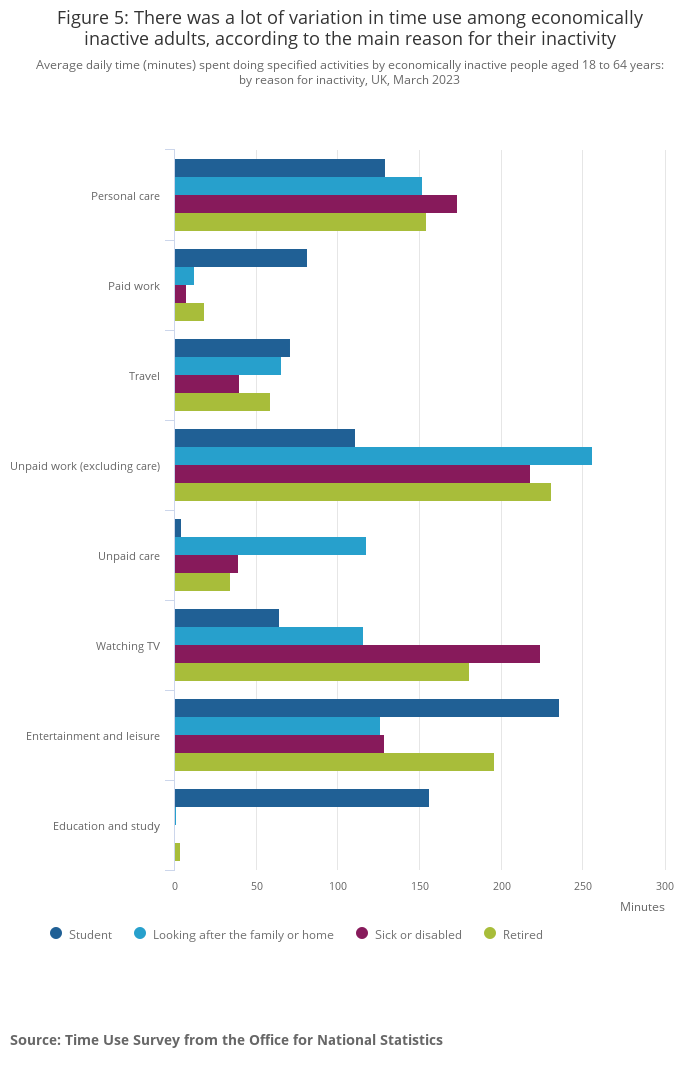
It’s fascinating therefore to look at the Office for National Statistics’ Time Use in the UK study, an experimental set of statistics that calculates the average daily time spent by adults on activities – including paid work, unpaid household work, unpaid care, travel and entertainment.
It uses a representative sample of 7,000 UK participants selected from the National Centre for Social Research NatCen Panel, and one chart breaks out the differences between what ONS labels as “economically inactive” people – the retired, sick or disabled people, those looking after the family or home, and students (even if they also have a part-time job, which is counted below):
Another way of looking at it as as follows:
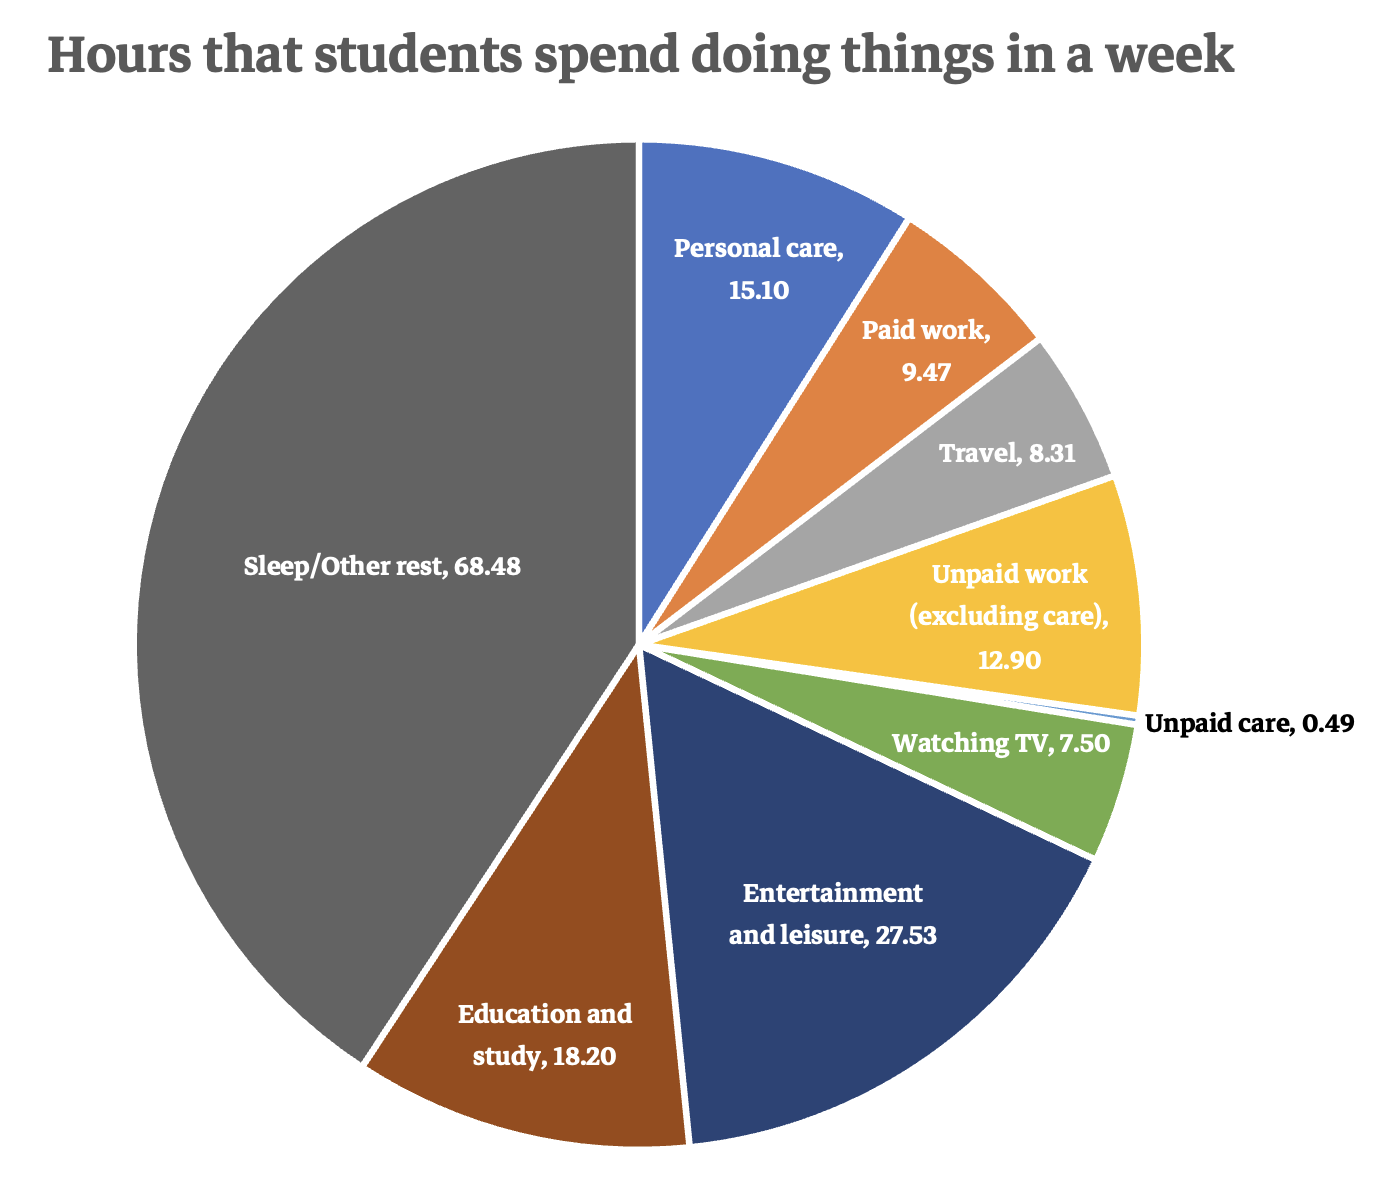
Because this isn’t a dataset focussed specifically on students, we can’t be sure that we’re looking at FT undergrads, and we don’t get splits – students are the split of subset of the overall population. There’s also no viable timeseries, yet. But it does allow us a sort of starting point from which to think through what the pressures appearing in other surveys might do to the overall pie.
We’re used, for example, to thinking about students who have caring responsibilities, students who live a while away from campus, and students who work longer hours than average. But we also know that most surveys tend to show concentrations of intersections of these sorts of responsibilities – and we’re less used to thinking about the compound impact on time.
So if a student lives 45 minutes further away from campus than the average and comes in three days a week, works 10 hours longer than the average and spends 21 hours a week longer than the average caring for others, that’s 35.5 hours that have to come from somewhere. Even if they cut out the entertainment and leisure and TV time of the average in the entirety, it still wouldn’t cover it.
Add in the deep frustrations of a broken and understaffed public transport system, timetables which appear to demand that students come to campus for a 9am and a 4pm without anywhere to sit or prepare food, and employment which is often skewed towards deeply unsociable hours, and you end up with a pretty miserable existence.
And crucially, you almost certainly end up without enough hours to complete the course successfully.
It could have been so much more
When the UK was engaging in the early discussions surrounding the Bologna Process and the creation of the European Credit Transfer and Accumulation System (ECTS), it somehow managed to argue that unlike the rest of member states, a standard academic year of 60 credits could be completed in 1200 hours.
Every other country went higher – Austria, Ireland, Italy and Malta on 1500 a year, Finland, Lithuania and Sweden on 1620 and Germany on 1800. Who knows which particular arguments were deployed for this special brand of British exceptionalism – but I doubt they hold up now.
Twenty years later in England, when the Augar panel had a run at designing a new maintenance system, it decided that a fair calculation would be to assume 37.5 hours a week of studying at 30 weeks a year.
I missed at the time that 1125 was 75 hours short of the amount suggested by the actual credit system, but then the government steadfastly ignored the whole chapter in its entirety anyway – with the total value of the maximum maintenance loan (outside London, away from home) now only covering about 31 hours a week when using the panel’s methodology.
And all of the above pretty much ignores the realities of postgraduate study – where again British exceptionalism assumes that a PGT course can be completed fifty per cent faster than much of the rest of the world despite the loan system underpinning it in England now barely covering the fees for “full-time” courses, let alone the living costs.
And don’t get me started on UKRI’s “New” (and worse) “Deal” on opaqueness over its standard stipend rates for PGRs.
The point is that whichever way you cut it, while we are clearly in a period where student poverty is a reality for many, we are also in a period of quite extreme time poverty too.
It’s what makes the Westminster government’s framing of non-continuation or poor graduate outcomes as the “mis-selling” of a “low-value course” so nasty – because even the best teaching and student support in the world can’t add hours to a day.
In the ONS study quoted in the piece, the following categories were used:
- Entertainment and leisure: Includes socialising, listening to music and other media, reading, playing games, going to the cinema, theatre, sporting evenings and other cultural activities, using a computer or device to check social media or do other things online, taking exercise, playing sports or doing other well-being activities. Also includes watching television, unless presented separately.
- Paid work: Includes working outside of the home, working from home, providing childcare, cleaning or doing odd jobs for pay, leasing or renting things you own, using your private vehicle to earn money (such as delivery services), showing your property to potential buyers, and selling things.
- Participation: Adults who are identified as participating in a particular activity are those who undertook and reported doing the activity (as a main activity) on their diary day.
- Personal care: Includes washing, dressing, using the bathroom, taking medication or other health-related care, eating, drinking and snacking.
- Travel: Includes travelling to and from locations, escorting others, or being escorted yourself, such as by taxi or bus.
- Unpaid care: Includes caring for children and doing tasks such as making meals and feeding, washing and dressing, playing with children, reading with children, and helping with homework. Also includes helping, caring for or looking after adults.
- Unpaid household work: Includes domestic housework activities (such as cooking, cleaning or doing the laundry), caring for pets, shopping and household administration (such as paying bills). Also includes “Do It Yourself” (DIY) tasks, gardening and volunteering, unless presented separately.