


Slowly but surely, we’re starting to get a picture of the ways in which the cost of living crisis is impacting student engagement, mental health and experience – with the impacts manifesting as much more pronounced in different parts of the sector for different groups.
Adding to the pile of evidence that the Department for Education and its counterparts around the devolved nations seem routinely determined to ignore comes this year’s iteration of the HEPI/Advance HE Student Academic Experience Survey, now in its eighteenth year.
There’s an attempt at some averages good news – perception of receiving good or very good value-for-money has risen slightly, although not statistically significantly, and still only on 37 per cent. The proportion of students whose experience exceeded expectations increased from 17 per cent to 19 per cent – again not much to write home about, not where we were pre-pandemic, and discounting Covid on a serious and sustained long-term decline from 32 per cent in 2013.
As ever it’s a big survey – 10,163 full-time undergrads responded, and all the right weightings have been applied to questions on familiar questions on value-for-money, assessment, volumes of teaching hours and experience compared to expectations, as well as new questions on the impact of cost of living and paid employment. Here we’ve pulled out many of the toplines from the report, as well as plenty you won’t find in the narrative that are hiding in the data tables.
Overall if anything, the problem is that looking at the averages increasingly hides much deeper bifurcations in experiences and resultant scores.
Value proposition
Arguably the topline – that when we adjust for Covid figures, value-for-money perceptions over the last 6 years have changed little – is pretty dispiriting. The report says that higher education institutions should consider using its data and engaging with their student body to understand why – but you can save some time by watching back the presentation I delivered at the Office for Students’ launch conference, back when OfS was concerned about such things and commissioned a group of SUs to research the issue.
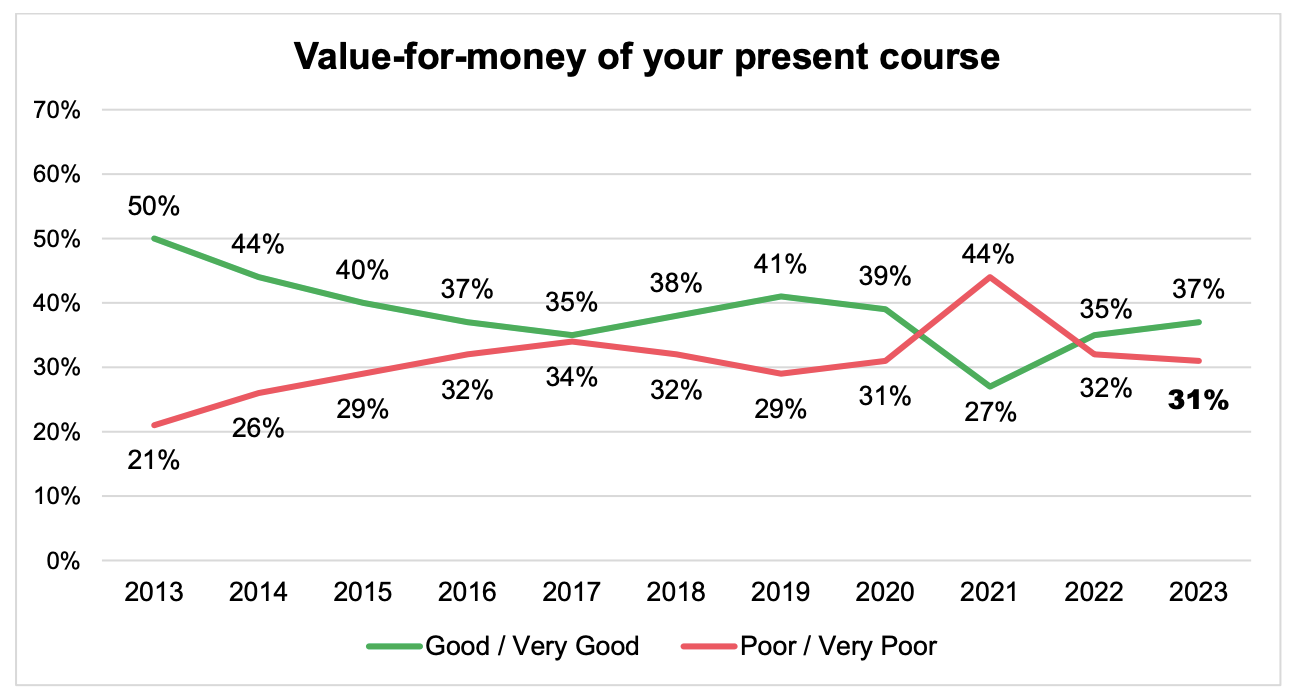
As ever there are some things universities can control and others they can’t. There’s quite a strong correlation between VFM and social class (with posher people expressing higher satisfaction), but there’s also a pretty strong link between VFM and contact hours, which the sector often seems keen not to hear. There are no differences between home fee payers and non-EU international fee payers on VFM, but it does deteriorate by year – perhaps a lingering impact of the pandemic.
Interestingly, there’s both a strong correlation with expectations being met here and cost of living impact on respondents. Of those impacted “a lot”, 45 per cent thought their course was poor value, whereas for those not impacted much or at all, just 17 per cent said that value was poor. As we discussed back at that launch, value is often about the extent to which students feel able to hit the expectations and norms set for student life, and the time to take advantage of it.
That’s livin’ not alright
One remarkable change over time, reflected in local authority planning decisions, is the switch away from students living in shared houses. In 2015, some 42 per cent of students lived with other students in an HMO, down to 24 per cent now – while those living at home or renting a room in private halls have both grown significantly, at least in percentage terms.
The big problem there is that those in a house share are least likely to be lonely – and it’s those at home and those in private PBSA that are most likely to be lonely.
Regrets, they’ve had a few, but not too few to mention
One of the things I‘ve reflected on before on the site is the levels of regret in the UK system – in other words students who would have chosen a different institution, programme or even not chosen HE at all if they had their time again. If we compare, say to the Netherlands, notwithstanding some statistical and system nuances, its National Student Survey has regret at 14 per cent – here it’s up at 42 per cent on average and as high as 52 per cent in alternative providers, and 55 per cent for black students.
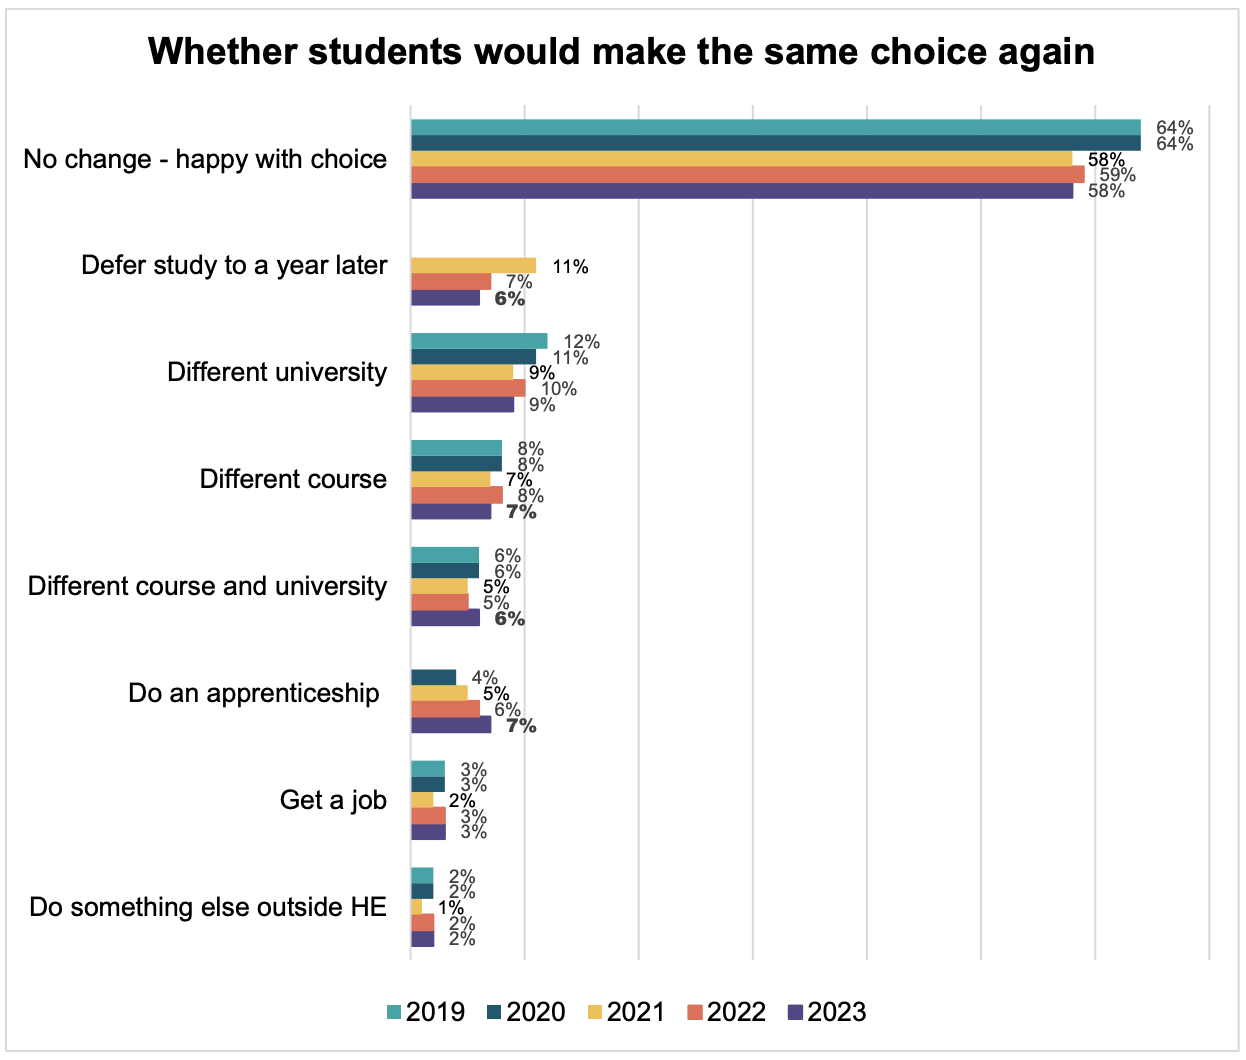
Oddly, the SAES report commentary seems at pains to highlight that the regret level for those doing apprenticeships is improving – but 45 per cent saying they’d do it all again is actually the lowest score for all qualification types (with the bachelor’s degree up at 61 per cent), and is hardly a sound basis on which to make Halfon-style recommendations of “incentivising increasing the number of degree apprenticeships” and “reducing the regulatory burden” attached to them.
Degree apprentices also have the lowest scores of the qualification types on expectations met, value for money, belonging, unstructured/disorganised teaching, teachers that are poor at explaining things, and the killer for the “yeah but you earn while you learn” argument, considering leaving because of finances. It’s almost as apprenticeship wage rates are scandalously low, and being a full-time one stops you getting additional part-time work. Either way, on this evidence, I wouldn’t advise anyone goes near this mode with a bargepole.
Stay away from those trapped doors
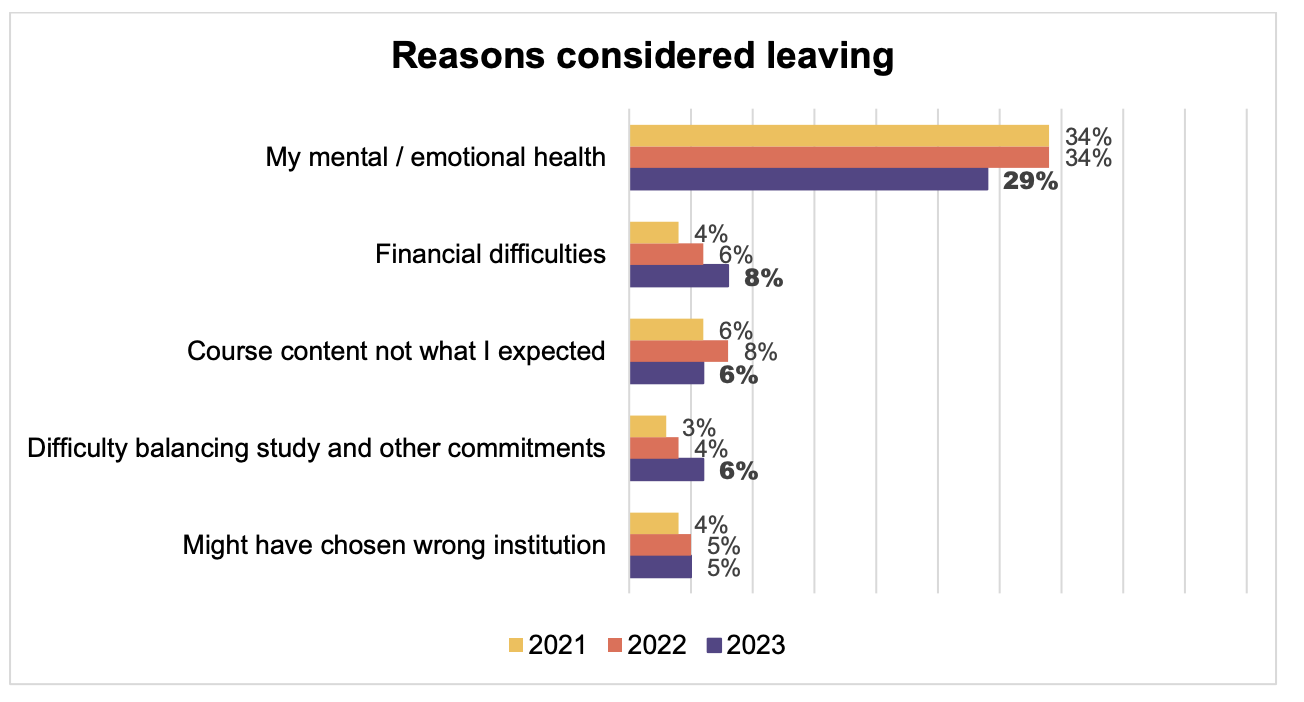
So if students aren’t dropping out in vast numbers but are, to some extent, unhappy and trapped, it’s still important to know why. Usefully, we learn here that the relative influence of mental health concerns is still dominant but has declined in significance – with cost of living rising significantly proportionally. Twice as many students have considered leaving due to cost concerns than was the case in 2021, and the proportion citing difficulty balancing study and other commitments has also doubled since 2021.
Unsurprisingly, students in post-92s have been hardest hit by the cost of living crunch (yet often their universities have the least per head in resources to alleviate) and student carers are also really struggling on this evidence.
Which free speech problem?
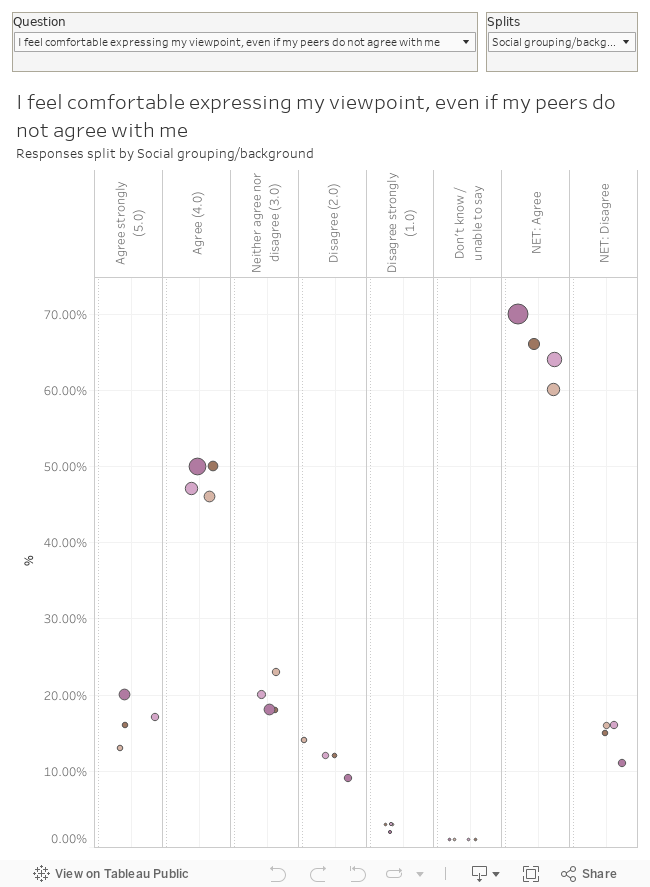
When it comes to free speech, 65 per cent are saying that they feel comfortable expressing their viewpoint, even if their peers do not agree with them – and a further 20 per cent neither agree nor disagree.
As we pointed out last year when we squirrelled some differences out of previous HEPI polling, this isn’t consistent across characteristics – disabled and BAME students are significantly less likely to agree here, reinforcing our findings that free speech is probably more about confidence and EDI issues than it is about campus wokery.
We’re not saying there’s a profile we could build, but students who don’t have many contact hours, do very little uni work, who aren’t in paid employment, and study psychology are particularly likely to report freedom of speech issues based on this sample.
Universities in England responding with intensified EDI work when a similar question pops out of their NSS results later this summer will hardly get three cheers from a tsar who seems to have been appointed to believe the opposite.
If you see the wonder
One interesting thing to do is work out who’s experience is not meeting their expectations – negatively. That those on 0-9 contact hours, third years (another possible Covid overhang) and those living over 50 miles away are all pretty miserable here – hinting in each case at a belonging problem.
The fact that those hit hardest by cost of living also have the worst scores here suggests that those who obsessively prize getting students into university without placing the same emphasis on resources to support those students are helping to sell those students a social mobility/opportunity pup that they end up pretty bitter about.
Access some areas
Importantly, there’s a pretty strong link between considering dropping out and access to academic staff, so another interesting way to interrogate the cross-tabs is to ask who is saying that that access is insufficient.
Those on less than 10 contact hours, those doing more than 10 hours paid work and those living 6-10 miles away (and so presumably battling with Britain’s buses) all have the highest in their category lack-of-staff-access scores – and again it’s social classes D and E that report worse access than ABC1s.
There also appears to be a big issue here for the major work-based learning areas, with subjects allied to medicine and degree apprentices all reporting significantly lower scores.
Intensity propensity
Counter to some other surveys, the total number of working hours (ie academic work) completed has seen a clear increase across the board – in particular in contact hours timetabled and attended – while placements are also at very high levels, against a slight decrease in independent study.
That all rubs up against findings on the volume of assignments, a measure in the survey that has been increasing consistently over a number of years. It accelerated during the pandemic (which the narrative surmises was a reaction to institutions not being able to deliver face-to-face teaching), but it’s still on the up, hitting a new high of 5.6 summative and 3.6 formative assessments being set per semester.
That’s not uniform, by the way – STEM subjects seem the worst at reducing assignments whereas arts and humanities seem to be cracking it. That does though leave one wondering why arts and humanities seems to be slowest at getting marks and feedback back to students.
As well as a workload issue for staff, the “load” clearly has impacts on students – high anxiety is up at 37 per cent, and as high as circa 50 per cent for LGBT+ students and disabled students. In the context of the challenges of generative AI, assessment load continues to feel like an area ripe for radical change.
Getting better every day
Often the problem with the SAES (and indeed the NSS) is that quantitative data leads to lazy hypothesising – so there’s a welcome and detailed analysis on suggested free text improvements to the student academic experience.
The most frequently raised topics, in rank order according to responses, were: examination and assessment support; quality of teaching and learning; mental health support; the impact of University and College Union (UCU) strike action; communication concerns; career development; and cost-of-living challenges.
In many ways the importance of individualised, quality and timely feedback from academic staff is not a new story – it’s consistently been the sector’s achilles heel on the NSS – and as I note here does make you wonder why it’s never seemed much of a priority for England’s regulator.
Interestingly comments on mental health support span traditional concerns about capacity and services, and aspects about adjustments and the actual teaching and learning. Advance HE published a mental health in pedagogy toolkit last year – it probably deserves more attention.
There’s a similar span in the comments on careers support too – with some students wanting a better (extra-curricular) careers service, and some desiring activity enabling them to be able to understand and apply the knowledge they acquire on their course to future career development – along with skills development that would help them in the “real world”.
That debate rages on in many departments, and I’d note that we’ve seen some interesting examples of practice in Europe this year.
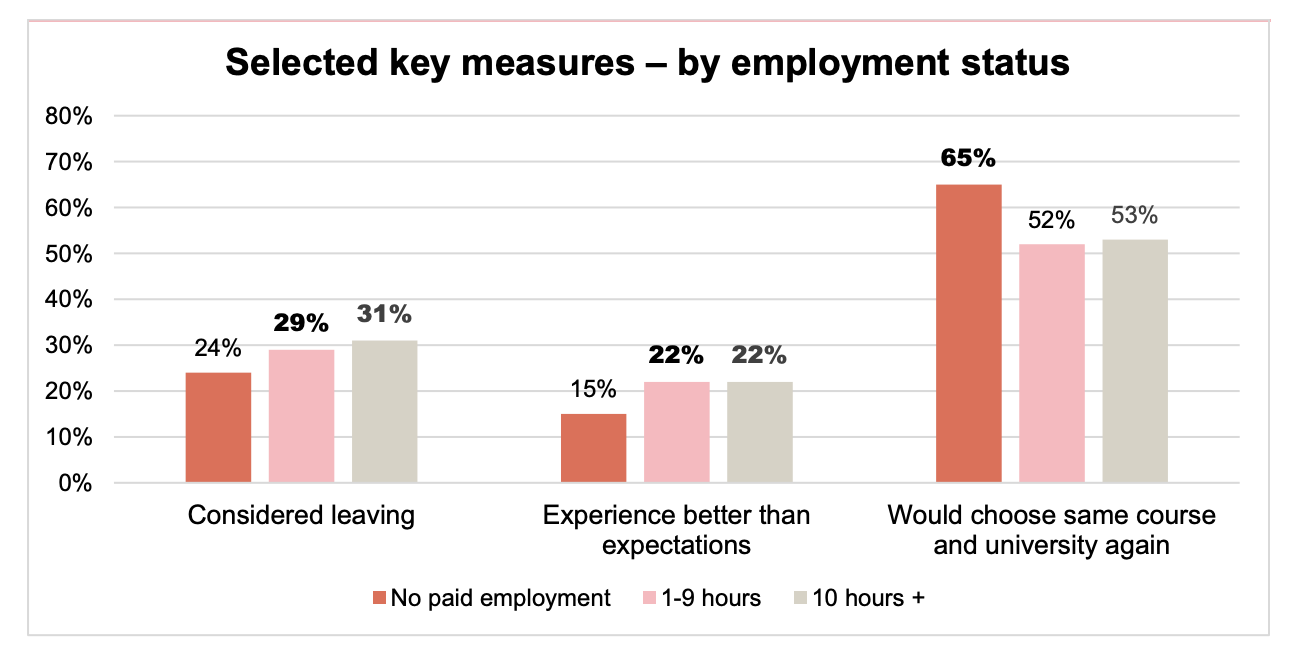
Gotta getta job
When it comes to paid employment, the report’s headline is that there’s been a clear uplift in the number of students doing it – up from 45 per cent to 55 per cent – but this is also about the hours they’re working. Frustratingly, the survey only allowed students to choose between no paid employment, 1-9 hours and 10 or over – when other research suggests that it’s working over 15 hours that really starts to impact on engagement.
Nevertheless there are some key differences – a dive into the muti-year tables tells us that the percentage working over 10 hours has gone from 17 per cent in 2012 to 34 per cent now. And one in four students working a modest 1-9 hours are spending 10-19 hours on their course, falling to 15 per cent of those working 120 hours or over, with similar correlations to employment hours on spending 20-29 hours on their course.
And there are differences by institution type too. In the Russell Group, just over a quarter are in paid employment for more than 10 hours a week, rising to almost 4 in 10 in post-1992s – suggesting the job of engaging students is getting harder in some specific parts of the sector.
Oh – and bearing in mind that the best student maintenance package is in Wales and Scotland and Northern Ireland’s are dire, it just so happens that the lowest percentage of students in PT work are in Wales, and the highest in Scotland and Northern Ireland.
There are some differences in why students work that surfaced in last year’s results too – 68 per cent work to support living costs, inevitably higher in post-1992s and both Scotland and Northern Ireland. It’s also much higher for those from state schools than private schools.
Meanwhile those lucky enough to be able to regard PT work as something enabling them to explore career paths differ by social class – 23 per cent of ABC1s, falling to just 12 per cent of D and Es.
Distance learning
One thing not covered much in the report but hiding in the Excel sheets is distance from campus. Those living 10 miles or more away hits a record third of all FT undergrads this year, with some quite strong correlations with teaching satisfaction, meeting or bettering expectations, and crucially loneliness – with 30 per cent of students living 50 miles away or more feeling lonely all or most of the time, as opposed to (a still worrying) 20 per cent who live a mile away.
Anyone that’s been following our work on belonging will nod along sagely here – reminding us that massification without housing capacity or decent transport links can have real costs to student mental health and engagement, and feelings of belonging to a community. Disabled students and those on less than 10 contact hours also continue to be a concern on sense of belonging.
Bits and bobs
It’s obviously not surprising that as we transition out of the Covid era, the report finds that the proportion of lectures that are being held online is on the decrease – but as the report says, it’s unclear whether students are accessing the remaining online lectures through choice, or because they are only offered in this format.
I’d add that even if a survey asked them about choice, it’s important to differentiate between what they want and need – our qual work earlier this year suggested that some surveys are taking a preference for online as an actual preference for not coming to campus, when it’s distance, life demands, part-time work and family commitments that are causing students to need online access but who still yearn for campus contact, if only that were viable.
That’s why sentences that say “challenges faced by students with caring responsibilities, those working to fund their studies, and those who travel long distances to study, may benefit from accessing online learning” may well both be absolutely right and absolutely wrong all at the same time.
On income, the report recommends that the government should review the mechanism used to increase maintenance in line with inflation, and “prepare the next Student Income and Expenditure Survey as a matter of urgency.” It actually commissioned NatCen to do so in 2021 – and presumably has the results on its desk but is likely loathe to reveal how tough things are getting.
Crucially, LGB+, trans and non-binary students are less likely to state that their living costs are covered by family support, and more likely to state that their studies have been affected by the cost-of-living crisis. The report recommends that the student finance bodies of the four nations consider reviewing communications and processes for estranged-student applications to ensure eligibility clarity.
I’d suggest that other surveys show these students to be already pretty clued up – and it’s the woefully low maximums and the expected parental contribution baked into the systems that is the bigger issue.
Getting a first
There’s a really odd quirk in the data insofaras “first in family” had been running at about 35 percent for a decade or so in the SAES, but then collapsed to 14 per cent last year. I initially though that must be Covid, but given it’s an all years survey, surely that’s not all a pandemic recruitment and drop out issue. Maybe there’s something going in with weightings, but if it is a pronounced pandemic impact on FiFs (who are rarely captured in other surveys and datasets), that’s a profound tragedy.
As we might expect, there’s twice the proportion of nurses (and wider subjects allied to medicine) that are FiF than there are doctors (and wider medicine), and a similar differential between arts and humanities and social sciences. Our future vets, engineers and creative artists all also appear to be much lower than average on FiF.
From the early days of OFFA right through to John Blake’s iteration of OfS access and participation, we’ve had constant resistance to looking at subject – a deliberate ignorance that looks increasingly hard to justify.
Valuable findings
In many ways, the SAES is a survey that has built its reputation on asking the “value for money” question before anyone else did. These days, we know more about the ways in which students make judgements about value – crucially, they are not doing so in a free-floating way – they are contextualised.
This is often about weighing up the barriers to students gaining value, versus the quality of what is actually offered. Assuming nothing material changes for students’ circumstances, universities need more than ever to understand students’ lives.
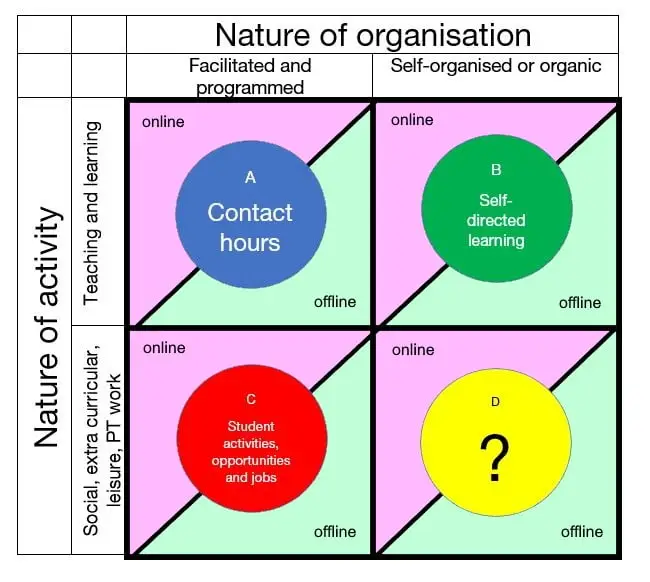
That’s about getting to grips with the specifics of how experiences like distance, poverty, and paid employment filter students’ ability to make the most of the learning opportunities afforded them. And it’s about being much more concerned about what’s going on in boxes B, C and D than we are with gathering satisfaction feedback about Box A.
After all, you can build the best provision in the world – but it will only matter if students can make the most of it. And if you can’t build the best provision in the world – taking steps to maximise students’ ability to access and engage with it may well be more impactful than endlessly tweaking it.


