


A spectre is haunting the university system – the spectre of “low-quality” courses.
And, like many other spectres, we have – at best – only circumstantial evidence that they exist as anything but ingrained prejudices and scary stories.
Getting away with it
Get behind the sofa (or the barricades, your choice), here comes Michelle Donelan, ably (well, she did say “New Labour” once) reading out a speech that was almost certainly written by Iain Mansfield.
Too many have been misled by the expansion of popular sounding courses with no real demand from the labour market.
Quite frankly, our young people have been taken advantage of – particularly those without a family history of going to university. Instead some have been left with the debt of an investment that didn’t pay off in any sense.
And too many universities have felt pressured to dumb down – either when admitting students, or in the standards of their courses. We have seen this with grade inflation and it has to stop.”
It’s an eye-catching accusation. Your departmental admissions officer has apparently been hanging around – shall we say “failing, coasting, and underperforming” schools? – tempting naive provincial 17 year olds away from wholesome apprenticeships with a bag of dodgy BA (Hons) courses under their trenchcoats. Really?
…if it wasn’t for your pesky datapoints?
At this point, you’ve probably heard my response to this agenda – which is “name one”. Find me courses within national data that are “low quality”. Define it however you like, but show me an attribute linked to a particular course rather than a general wave of the hand at anything non-STEM.
There’s three things I want to look at specifically:
- Whether some subject areas recruit disproportionately from young people less likely to be able to call upon higher education expertise (POLAR quintile 1)
- Whether these subjects (at a broad level) also lead to poor outcomes, as expressed by graduate salaries (LEO, 3 years after graduation)
- Are there courses or smaller subject groups that recruit from non-traditional groups and lead to poor outcomes?
Let’s start at a subject level – for reasons we’ll get to. Are there particular subject areas that are disproportionately recruiting from POLAR quintile 1?
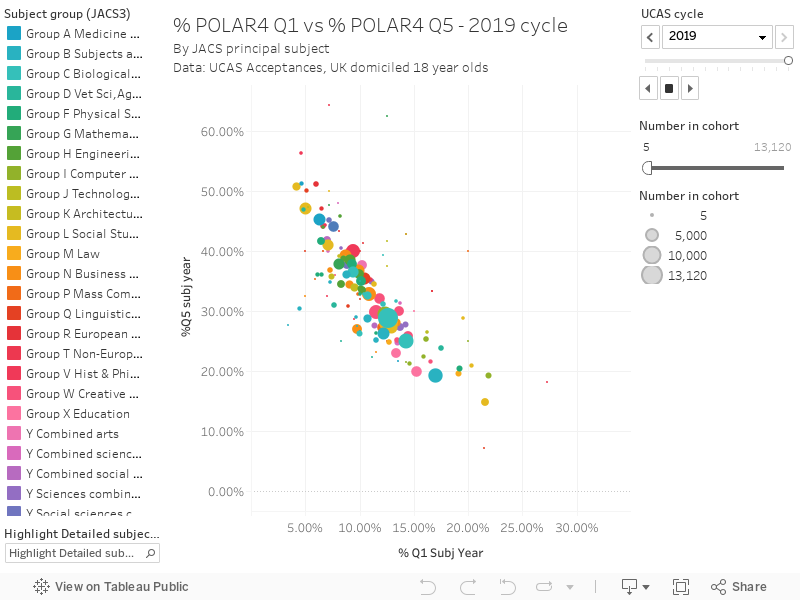
The above graph draws on data about 18 year old UK domiciled acceptances via UCAS – showing the percentage from a POLAR Q5 (most likely to historically attend HE) background against POLAR Q1 (least likely to historically attend HE) background. By highlighting a specific subject and hitting play, you can watch how things have changed since 2007.
Towards the bottom right, with a higher POLAR Q1 acceptance level, we see a bunch of courses that link to not-particularly well paid jobs that are really hard work – like social work, nursing, social policy. There’s also courses that have been designed to attract those less inclined to further study to gain valuable STEM skills – forensic science (famously few jobs, but a great qualification for anything from hospital labs to the pharmacology industry) and computer games design (a hugely useful primer in programming and interface design), and courses linked to professional support careers (others in law, animal science).
Up at the top end of the social scale, we find (alongside the expected high-tariff medical courses) key employer-led courses like, er, geography, classics, and economics (and before anyone talks about a massive demand for economists, it is the “quants” that banks are after – usually from physics and maths backgrounds).
POLAR isn’t a brilliant proxy for multiple deprivation, but for identifying those less experienced (and able to access less experience) about higher education it could have been designed for the task. And is there any evidence for a “useless” course epidemic in POLAR4 Q1? No. Providers are not going around coercing gullible young people onto “useless” courses.
Behind the mask
So, knowing that recruitment doesn’t give us any indication that inexperienced applicants are falling for the smooth tongues of, say, the government’s own “Discover Uni” site – shall we take a look at outputs?
We will experience a problem with one of our most important variables, as there is substantial evidence (from the government’s own LEO data, to give one example that is probably in Michelle Donelan’s inbox somewhere) that people from less advantaged backgrounds will always earn less than their more advantaged peers, whatever else they do in their lives. But, when we plot this by subject and provider, it is notable how little impact we see.
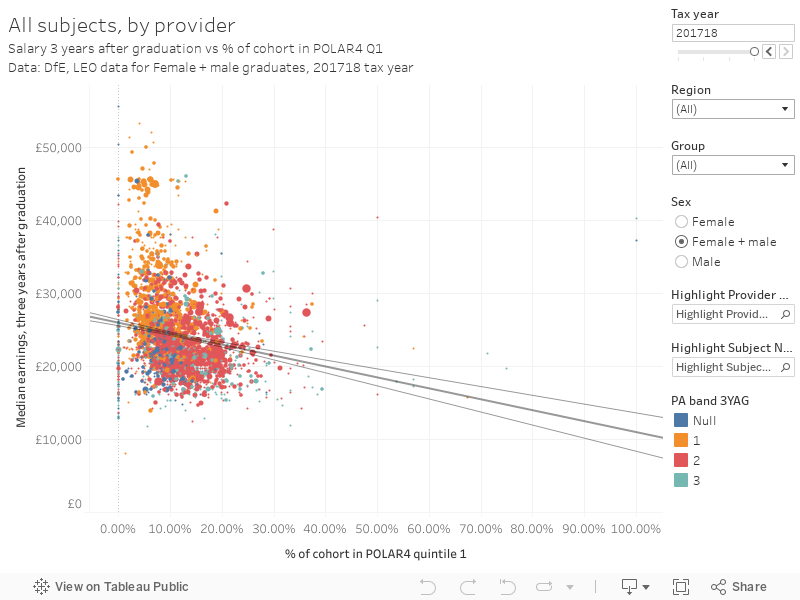
Here, I’m showing you data from the most recent LEO release, which includes data by for the percentage of students from POLAR quintile one, and three “prior attainment bands” which I’ve used to colour the points. I’ve plotted every provider and subject combination for three years after graduation, and you can look back four tax years if you are interested in the historical trend. There’s highlighters for subjects and providers.
What you are looking at is a multicoloured blob with an r squared value of about 0.04 – there’s no correlation at all. When a POLAR Q1 heavy engineering studies at Moulton College offers a better salary return than a similarly sized engineering subject group largely from outside Q1 at the University of Reading (making no claims for accuracy, this is just what is in the data being shown to thousands of applicants by Discover Uni), you may need to rethink some rather lazy assumptions. Creative Arts at Brunel or Education at King’s College, London? – the former gets you better pay, and teaches more students at POLAR Q1.
Abandoned theme park
I’ve been talking a lot about subjects, and throwing a lot of shade at Discover Uni, but the much-maligned UniStats reskin is the only way to look at sector data by course. After a fashion.
In the main you are looking at data based on an aggregation at subject level. Below, I’ve plotted the three year LEO data against the percentage of students that entered with three Cs at A level or equivalent or higher as provided for each individual course that the data that underpins Discover Uni contains. There’s no POLAR or anything else about graduate backgrounds in this data, so I’ve used prior attainment as a proxy measure of “non-traditional” recruitment (less advantaged students tend to do worse in level 3 exams, but people that do worse at A level also tend to earn less whatever they end up doing next.)
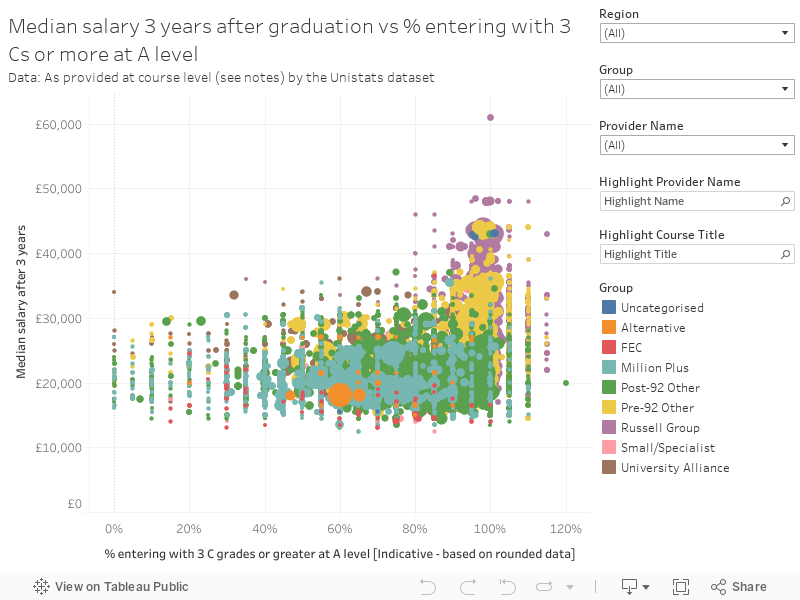
Again, we search in vain for a correlation at course level. You’d think that a course that takes primarily students who didn’t do as well at level three would lead to graduates that earn less than those who took more selective courses. But a BA (Hons) history at York (£25,000, with 99 per cent of the cohort getting three Cs or above at level 3) looks like it pays about as well as a BA (Hons) business and management and dance at Bath Spa (£25,000, 80 per cent getting three Cs), or a BSc (Hons) accounting and management with business experience at Kingston (£25,000, 0 percent getting three Cs or above).
If you’re wondering about those courses where more than 100 per cent of students have three Cs at A level or better, this is an artifact of the rounding used in the unistats dataset. You should take the figures as comparative and indicative, rather than as accurate representations of entry tariffs.
The mystery machine
It’s clear that you can’t make any meaningful value judgments based on these, or any other available metrics, at course level. Yet we still offer these metrics to prospective students, as they are the best that are on offer to give an indication of what their chosen course might be like.
Our minister and her advisors have confused indicative data with precise data, and the general with the specific. It’s easily enough done – though I note there are some serious data wonks at DfE who could and should have pitched in at some point. It’s an embarrassing mistake, and I’m sorry to be the one to point it out.
But somebody needs to, or we could end up not just with a bad speech, but with bad policy.
How else could we reliably spot a “low quality course”? SpADs and other are welcome to leave suggestions about other data here, and I’d be glad to take a look.
- I was asked about employment, further study, or both three years after graduation, against POLAR Q1 %. No link.


it would be interesting to pull out the data for an Oxbridge degree in PPE. Just to see what the control baseline is for most MPs.
Use the “highlight course” box on the third graph – search for “Philosophy, Politics and Economics”.
About the same salary outcome as Pharmacy at Brighton.
I remember a New Labour schools’ minister once who said something like “I want all schools to be capable of doing better than average …”
Donelan is on a par with that level of idiocy. Maybe what she really meant to say was: “I want all students to be able to go to the top universities and get above average salaries…” but her spad had to edit that into some other form of nonsense?
I particularly liked the subtle inclusion of History at York in the comparison with management and dance at Bath Spa 😉 … I remember back in the 1980s York university being singled out as an outlier in giving a seemingly high proportion of firsts than you would expect… could there be a correlation with the number of ducks in ponds at top Universities? I think we need to know!
Excellent article and evidence-based demolition job, made my Monday morning.
Good work, David!
Courses like nursing and social work are undeniably low value because the wage is so low compared to the money spent there is not way essential workers should have to spend that much in order to do such low paid jobs.
The counterargument would be that nursing and social work are essential societal jobs that need to be done with a great deal of skill and understanding – and are currently undervalued significantly.As most graduates are employed in the public sector it could be argued that this state of affairs is a deliberate government choice, and students aspire to these roles (and those who teach them) should not be penalised for this choice.
Deeper research of graduate employment has been carried out in the past, such as the Wakeham Review of STEM Degree Provision and Graduate Employability . Again the outcomes were mixed: some programmes with poor records of graduate-level employment were based in low-tariff universities but others were the opposite. The review recommended further investigation of several areas but I do not recall seeing this following up.
That wasn’t a “New Labour schools minister”, that was Michael Gove.
Apologies for the delay but I’ve only just discovered your ‘back catalogue’ of articles. A fascinating analysis. Thank you.