


We’ll almost certainly never see a LEO release that covers all of the known non-subject non-provider characteristics that affect graduate salary.
As a reminder, previous releases have demonstrated that the following characteristics have a statistically significant impact:
- Subject area
- Provider
- Sex
- Prior attainment/background
- Current region of residence
We don’t get anything on providers today – others are present and correct, but there are simply not enough data points to offer a look across all of these aspects for graduates who attended an English provider. It’s an odd headline finding, but if you take one thing away from this release, take:
it’s not possible to safely use LEO in policymaking (though it remains an interesting research dataset)”
What’s new
There is, however, an extra tax year of data. For most (but not all) splits you can look at graduates one, three, five, and ten years after graduation for tax years between 2014-15 and 2017-18. Current region of residence makes a long heralded entry – but the only splits available are by sex and subject. And there’s more detail on the ethnicity of graduates – when you get down to the fine grained details you struggle with very low numbers, but it is good to have it in there.
We also see data for international students, but only where they have a national insurance number and worked in the UK at that point. The accompanying report does compare UK, EU, and non-EU graduate earnings – but there are a number of caveats that need to be applied to the finding that non-EU graduates tend to earn more when working in the UK.
The four years of UK domiciled data shows evidence of an increase in nominal graduate earnings at one, three, five, and ten years across most the four tax years. However, these are not increases in “real” (inflation-adjusted, using CPI) earnings salaries have dropped over the four year period for all but those one year out of university.
Before you get to writing a comment piece for a broadsheet on that last one be aware that the differences are slight (in most cases less than £1,000) and refer to median earnings not the earnings of any individual graduate. The “real” earnings fall is due to price rises, not a decrease in the attractiveness of graduates as employees.
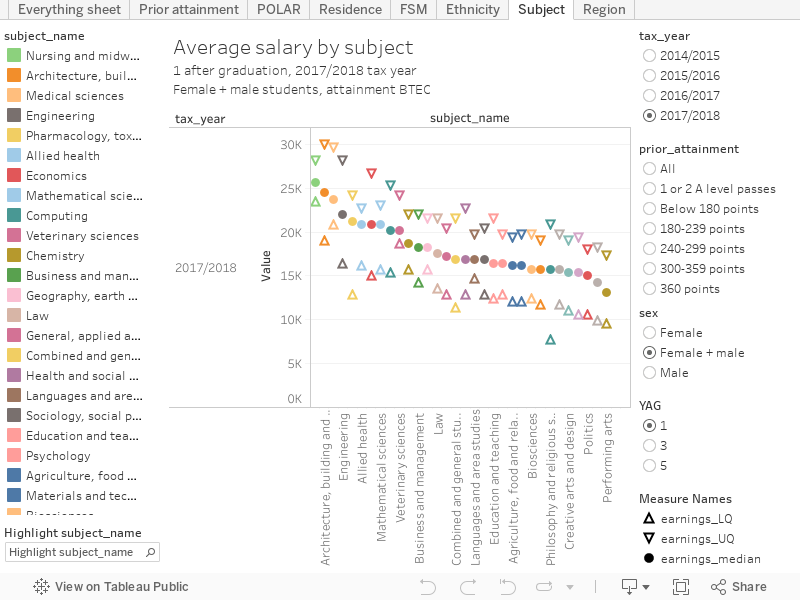
Subjects and prior qualifications
Looking at earnings by subject through the lens of prior attainment is interesting – sadly we can’t split by sex here so do bear in mind the effects of the somehow-still-a-thing-in-2020 lower rates of pay for women in many sectors.
Everyone knows that economics and medicine are the big earnings winners in these charts – but if you have less impressive A levels or equivalents you may want to look into architecture, engineering, mathematics, and computing too for earnings potential over those five years. If you entered university with a BTEC, you’d have earned more your first year after graduation in nursing.
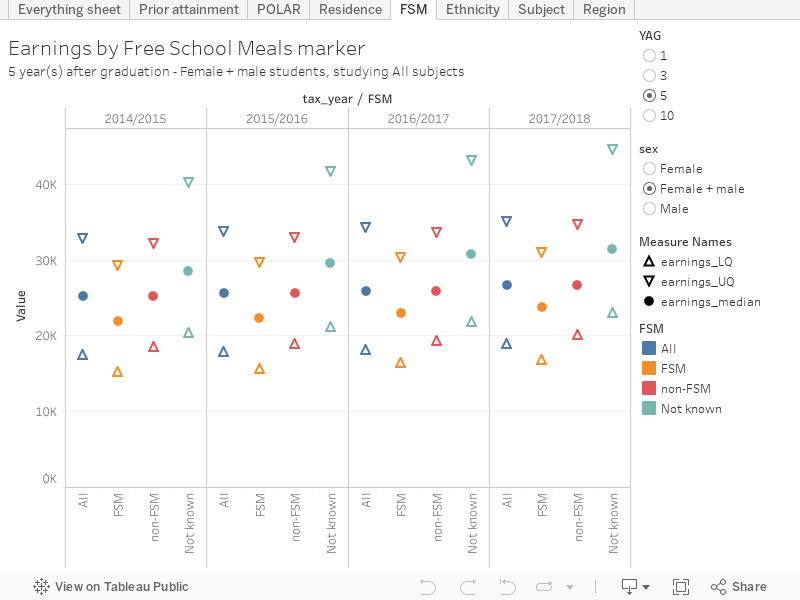
Background still matters
It’s not something this report particularly dwells on, but your non-academic life before university matters for a good while afterwards – in terms of your earning potential, at least. As a very simple example, those with the “free school meals” marker (meaning that parental income dropped below the threshold at some point) still see a substantial salary impact five years on. Here you can split by sex (no real difference) for up to five years after graduation.
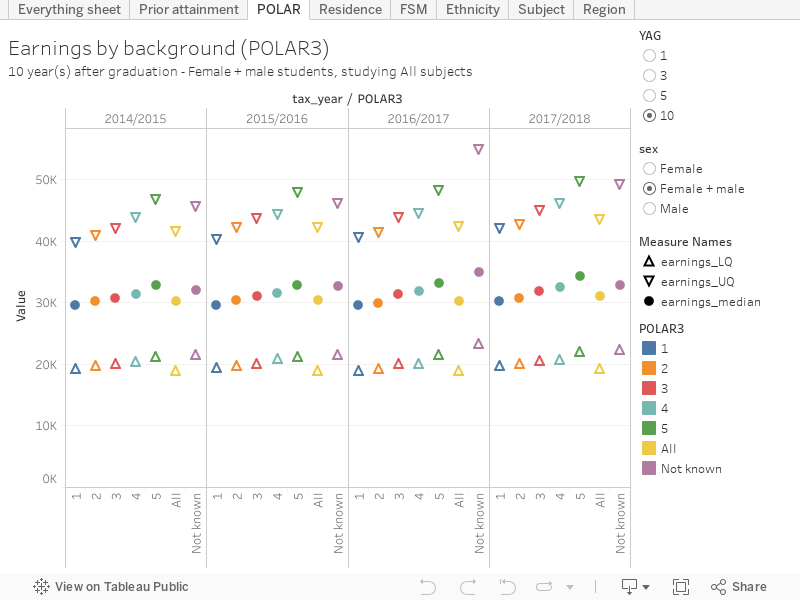
The number of graduates in the local area has a lasting impact too. The POLAR3 quintile you were in when you applied is a decent predictor of your salary right through to 10 years after you graduate – those in POLAR3 Q1 earn £2,000 – £3,000 less than their peers by this point.
And it is less obvious, but you are more likely to live at home while you study if you are from a disadvantaged background – which explains the gap between those who lived “at home” and “lived elsewhere” while studying, a decade on. Here, the gap appears to be growing over time.

A note on ethnicity
One of the best uses of LEO data is to demonstrate how terrible the UK job market is. There is no reason Black graduates should reliably earn less than their peers where data exists at any point after graduation, but the gap persists over a decade.
We get three ethnicity splits in this release – including a detailed one, which is commendable but does tend to produce the kind of very small numbers that lead to statistical concerns. I’ve plotted instead the top level categories version that includes Chinese as an ethnicity. Again the numbers are small, but Chinese students tend to be among the higher earners.

Other data
I’ve also plotted – for the keen – a way into all the data (with the exception of the detailed ethnicity stuff for the reasons detailed above) that you can get to on tableau. I usually build these to help me understand the way the data is set out – with some people having more time on their hands at the moment I thought I’d leave it live for the keen.


