


The fifth iteration of the teaching excellence framework represents a welcome pivot away from the metrics-driven approach we’ve come to expect.
A big chunk of every award comes from information the provider itself has submitted about how marvellous it was.
Indeed, two pints to the good and if you squint a bit, TEF almost looks like Centres for Excellence in Teaching and Learning (CETLs). Or the QAA’s own Higher Education Review (indeed, in being cyclical and involving the opinions of students, TEF is closer to international quality assurance standards than the Office for Students’ actual quality assurance system).
The sorry tale of subject TEF
TEF in its current guise focuses on quality enhancement – examining ways to make teaching better, rather than just ensuring that it is good enough. And it focuses on whole institutions.
Back in the before times, this wasn’t the case – the policy intention was to move towards a subject TEF, and the majority of TEF awards came from the application of a handful of outcome indicators and student survey results. There were submissions too, of course – the final iteration of the Subject TEF plan suggested one per subject area plus another for the whole provider.
This all very nearly happened – Gavin Williamson wanted to run a Subject TEF over 2020 and 2021, what with there being no other pressing higher education issues to deal with at that time. Happily the much delayed Pearce Review of TEF put paid to the idea in January of 2021, with the government meekly conceding that:
we do not want the OfS to proceed with any form of subject-level assessments as part of TEF at this time.
And – fair enough, frankly. It was going to cost the sector about £110m, and bring about those massive submission burdens as discussed above. However, Shirley Pearce did like the idea of subject level data within TEF – so to this day it remains in the indicators as a split: to entertain the assessment panel, and provide useful information to providers.
Subject TEF (Taylor’s version)
All of which, on a recent train journey, got me thinking. If all the data is there at subject level (CAH level 2 in fact) – with benchmarks – it is possible to generate old fashioned flag scores. And if I can do that, I can come up with a few arbitrary rules – mixing the data focus of the old version with the dual sub-award structure of the new version, and…
Yes. I’m sorry. It really is the worst aspects of both. Here’s the key decisions I made:
- I stole the “flags” concept from the original TEF – one standard deviation above the benchmark on each indicator is a single flag[+], two would be a double flag[++] (below the benchmark gives me a single[-] or double[–] negative flag). I turned these into flag scores for each sub award: [++] is 2, [–] is minus 2 and so on.
- If there’s no data for a subject area at a provider, even for just one flag, I threw it out of the competition.
- For the Student Outcomes sub-award three or more positive flags ( or the flag score equivalent of [+++] or above) gives you a gold, three or more negative flags or equivalent gives you a bronze. Otherwise you’re on silver (there’s no “Needs Improvement” in this game)
- For the Student Experience sub-award, the flag score equivalent of five or more positive flags lands you a gold, five or more negative gets you a bronze.
- Overall, if you get at least one gold you are gold overall, but if you get at least one bronze you are bronze overall. Otherwise you get a silver.
- There’s different awards for full and part time provision. In the old days you’d get your “dominant mode”, here you get a choice (though as above, if there’s no data on even one indicator, you don’t get an award).
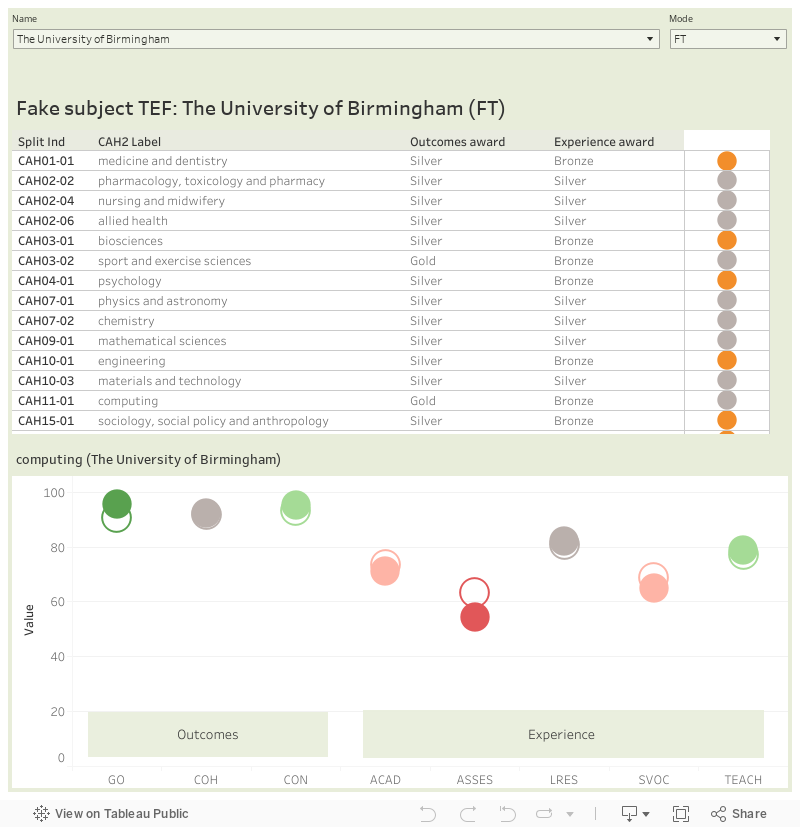
Here we go then, hang tight. The first table lets us look at all provider results in a subject area.
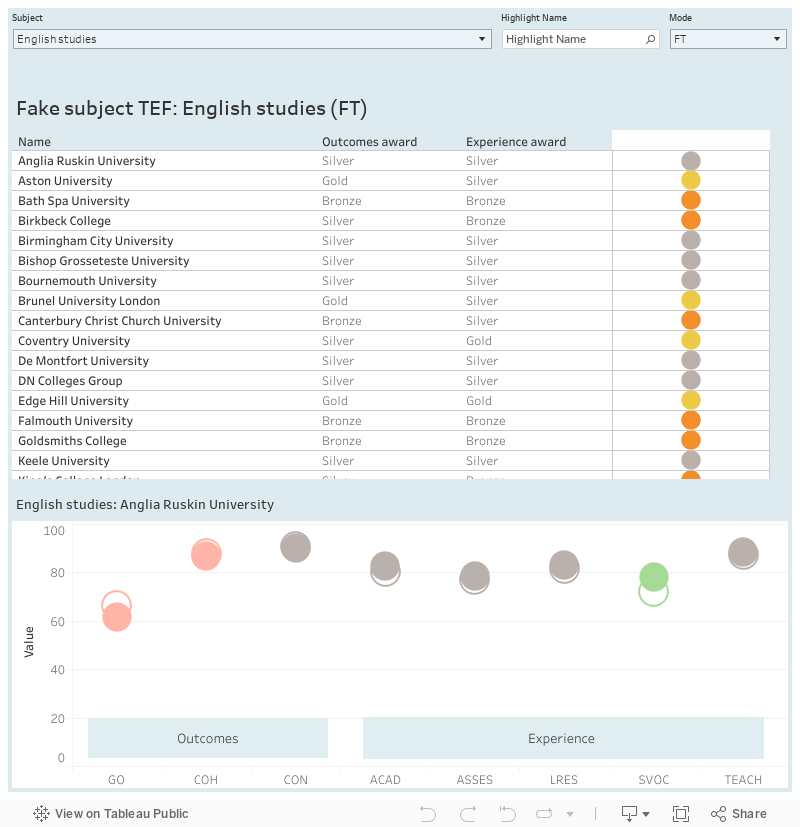
Select the subject and mode of delivery at the top, then scroll down the list. If you put your mouse over a particular award, it shows the results at indicator level (remember there’s no provider or student submissions here – awards are calculated from indicators only).
If you want to look at all the results for your provider, this is the table you need.
There’s a serious point to all this
If you take a glance down your institutional one, you can see that outcomes are very variable across subjects in a single provider. Some of this might be due to conditions linked to that particular subject nationally (have a look at the subject area one to check), some may be linked to a local position.
I’ve shown these charts to a fair few senior staff in providers – and one of the most common things I’ve heard in relation to an outlying result is “ah, I know why that is”. Sometimes they’d tell me about particular circumstances linked to a single large cohort, most often they’d tell me about plans to address known issues. And, as I’m no regulator, I feel safe in saying these were good plans – and often reasons outside of a provider’s direct control.
Please don’t take these results as a comment on the value of what your provider offers – please do take them as a set of indicators that will help you know where to focus attention to address problems. There’s also a value for findings like this to applicants – see it here as a Discover Uni at a sensible level of aggregation.
There will never be a Subject TEF on the current model – the burden around the number of submissions needed is simply too high. It has been good to see the B3 investigations getting stuck in at subject level – and an overall qualitative review (say of teaching practice in business courses) would be immensely valuable. But we should never forget that TEF awards are a proxy for a whole range of student and graduate experience – subject area is just one obvious split to focus on to pull this apart.
It’s probably only David and me who remember CETLs now: https://www.academia.edu/4697241/The_failure_of_the_CETLs_and_the_usefulness_of_useless_research_SRHE_News_8_Editorial_May_2012