


We’ve always been rather on the fence about longitudinal education outcomes (LEO) data here at Wonkhe. The research possibilities are fascinating, as the Institute for Fiscal Studies has shown, but the assumptions are too big, and the counterfactuals too obvious, to make for a serious policymaking tool.
Phillip Augar’s panel draws on LEO to make assertions about the state and variability of the graduate premium, but the report is careful to enumerate the “limitations to the analysis”. The hint is dropped that data on the full lifetime earning premium will be essential to the completion of the full post-18 review. We’ve seen no sign of that – the most recent release is simply another iteration of the data relating to students under the age of 29.
Background information
But there are some new aspects. For the first time, data on the percentage of students from POLAR3 quintile 1 (England and Wales only), and the median prior attainment (England only), is available by subject, institution, and cohort. While elements of this will be familiar from Unistats (where, of course, LEO data can also be found), this is the first time we’ve had this information in a mainstream Department for Education (DfE) data release.
And it’s mesmerising stuff. Across subject areas and across years, there is a clear trend towards a medium to strong correlation between graduate earnings and median prior attainment. In other words, your A level results are an excellent predictor of the median institution/subject post-graduation salary – and this relationship gets clearer with each successive cohort. Looking at a large subject like Business shows us R squared reaching 0.75 for five years after graduation in the 2016-17 tax year – up from 0.69 in 2015-16 and 0.67 in 2014-15 (p>0.0001).
Perhaps more alarmingly, the relationship between median prior attainment and median earnings grows over time for each cohort. To take another example – the relationship is less strong in sociology, social policy, and anthropology. But for the class of 2010-11 r-squared is 0.54 three years after graduation and 0.58 five years after graduation (p>0.0001).
These findings will not make for helpful reading for a minister desperate to root out “poor quality” courses on the assumption that these are the courses that lead to low earnings. The impact of the choice of university and course choice on graduate earnings will need to be cross-referenced with the impact of A level results. This first glimpse suggests that the data is there (though alas we don’t have enough in the public domain) – perhaps DfE (or IFS) will be able to test this link.
The visualisation
This is a complex set of charts, and I suggest you use the full screen link below to look at it.
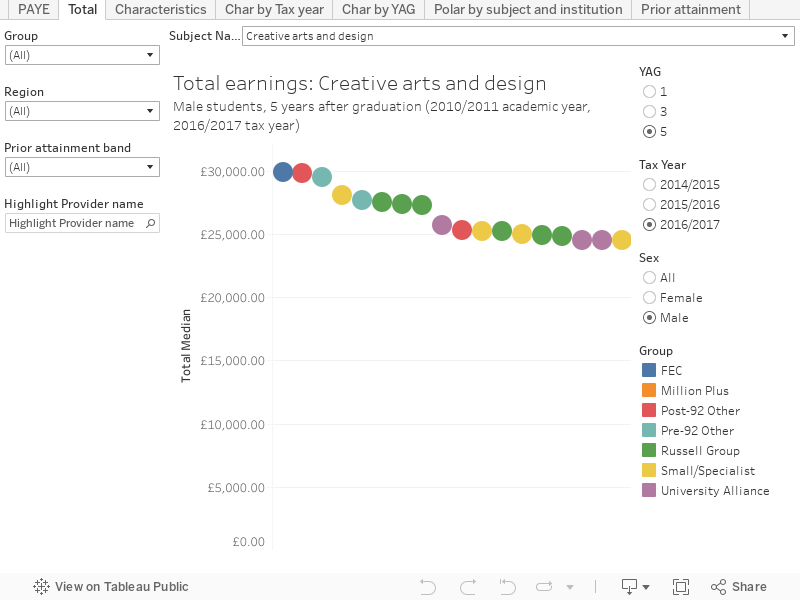
There are seven tabs at the top, as follows:
- PAYE and Total are the ones you will have seen before, showing the appropriate median earnings by subject, years after graduation (YAG), tax year, and sex. I’ve included filters by institutional group and region, plus there’s prior attainment band. This latter is provided by DfE and separates the institutions into the top 25 percent, middle 50 percent, and bottom 25 percent (Scotland and Wales are not available). I’ve put the upper and lower quartiles in the tool tip, alongside the number of graduates with data.
- Characteristics plots median earnings against the percentage of the cohort in POLAR3Q1 and median prior attainment – by institution, subject, tax year, and year after graduation. The prior attainment data has clearly been normalised. The size of the marks are the percentage of the cohort in sustained employment, further study or both. Char by tax year lets you look at multiple cohorts the same number of years after graduation, Char by YAG lets you look at a single cohort over multiple years where this is available in the data.
- POLAR by subject and institution celebrates the fact we have a more nuanced look at this data than we usually get. You can see the percentage of students from POLAR3Q1 at each institution by subject, and select your graduating cohort using the filters. This will be interesting to those wondering if particular parts of particular institutions are leading the way in widening access and participation, and whether this links to prior attainment (the colour scale shows the latter). You could see this as the beginnings of subject level access and participation data!
- Prior attainment shows institutions by median prior attainment for each subject. I’ve used the one year after graduation data for clarity, but you can choose your academic year. The median salary is shown by the size of the dot, and the percentage of the cohort in POLAR3Q1 by the colour.
What’s in the stars for LEO?
With the lifetime graduate premium trailed in the Augar report I figured it was time I added in my own personal wishlist for this controversial dataset. At the top would have to be the region in which graduates are working. To claim that the region in which taxpayers live is “not known” seems fishy – I’m sure HMRC would be able to find people fairly quickly if they suspected that tax was not being paid. And finding the region of PAYE employers (as a starting point) should be trivial. [EDIT: since publication I have learned that data on graduate salaries by region is on the way – and is due out on 18 July]
I’d love to see more comparative data on different employment sectors for graduates and non-graduates. Looking at, say, computing as a sector would help us see any graduate premium as a component of the performance of the sector overall. Are all salaries rising or just graduate salaries? Does a “glut” of graduates entering an employment sector depress wages overall?
And finally I’d like to see a LEO for schools. The school a person attends clearly has an effect on their salary – it would be fascinating to see this. At the very least, more data on prior education (private? public? FE?) could be added to higher education LEO.


Thanks David for the great viz.
Is there any chance you could add a “salary by subject by institution” view too?