


The HESA Estates data collection holds a peculiar place among the HESA open data offerings.
Unlike the collections you most often see, the data items are chosen and defined by the sector itself – in the form of the Association of University Directors of Estates (AUDE).
It is designed to allow estates managers to benchmark their own institutions performance against peers – and is primarily used in the annual production of AUDE’s Estates Management Report (EMR). There’s an executive summary available to the public, but the full report – available to AUDE members only – is quite something.
The sector’s most important dataset
Though AUDE members get a lot of value from the collection and analysis of estates information there is a burden inherent in any data collection. The past few years have seen an intensification of data collection, fostered in England by a desire for “data driven” regulation – data returns have become more complex, and the stakes have become higher.
Something clearly has to give, and the Estates collections’ status as an optional return (that providers need an optional services HESA subscription to make!) mean that an increasing number of providers either make an incomplete return or don’t make a return at all. Incomplete data makes it less easy to make generalisations about the state of university estates, and less easy to identify common problems that could be resolved by joint working.
To this end AUDE has been working with HESA, the Office for Students (OfS), and the Department for Education (DfE) to specify a leaner dataset – focusing on collecting what is really needed rather than what is simply nice to have.
The fact that the regulator and department are involved should tip us off that AUDE is not the only stakeholder here. The Estates collection is also the only means by which we collect environmental data about the higher education sector. Like every government department, DfE is keen to see a reduction in carbon emissions in order to reach the government’s net zero target by 2050, and has supported the design a tertiary education sector specific Standardised Carbon Emissions Reporting Framework (SEF) – developed in for DfE by the Environmental Association for Universities and Colleges (EAUC), AUDE, and others.
Estates data, in other words, is probably the most important data the sector produces (in wider planetary terms). As we’ve been over on Wonkhe before – it is striking how little interest the Office for Students has shown in the issue. And despite former chair Michael Barber’s no doubt well-meaning protestations, OfS has continued to show little interest in the environment in the years since we first raised the issue. A promised insight brief has not materialised – and neither has the OfS’ own full sustainability plan (though the 2021-22 annual report did note that OfS and Research England used just 20 reams of A4 paper that year – while the 2022-23 iteration saw that rise to an astonishing 780).
Emission impossible
The 2021-22 data is expected to be the last hurrah for the old, full-fat, Estates collection. Jisc (HESA’s owners) are expected to move forward with a DfE endorsed plan to reform the data to encompass the proposed “lean” AUDE reforms, the EAUC SEF, and a handful of other statutory essentials – reducing the return size by around 80 per cent.
At Wonkhe, we’ve always taken great pleasure in producing our annual car parking ranking from Estates data – which over the past few years has become enmeshed in many university strategic targets and performance indicators. Car parking provision is unlikely to be included in the new collection – we’ve seen the collection size and data quality dwindle over the years, so this feels like the perfect time to put the series to bed.
AUDE and EAUC have particularly urged providers to continue to return emissions information during this transitional period – so I think it’s long overdue that we take a look at that.
We’ll start with Scope 1 and 2 carbon emissions. These are emissions either made directly by the provider (Scope 1: stuff like running vehicles, fuelling generators, and so on) or made indirectly (Scope 2: for example buying gas or electricity to use in running buildings). These are also the carbon emissions that a provider has most direct control over – universities can and do decide to use more efficient modes of transport, change energy supplier to one focused on renewable generation, and invest in more efficient systems and equipment.
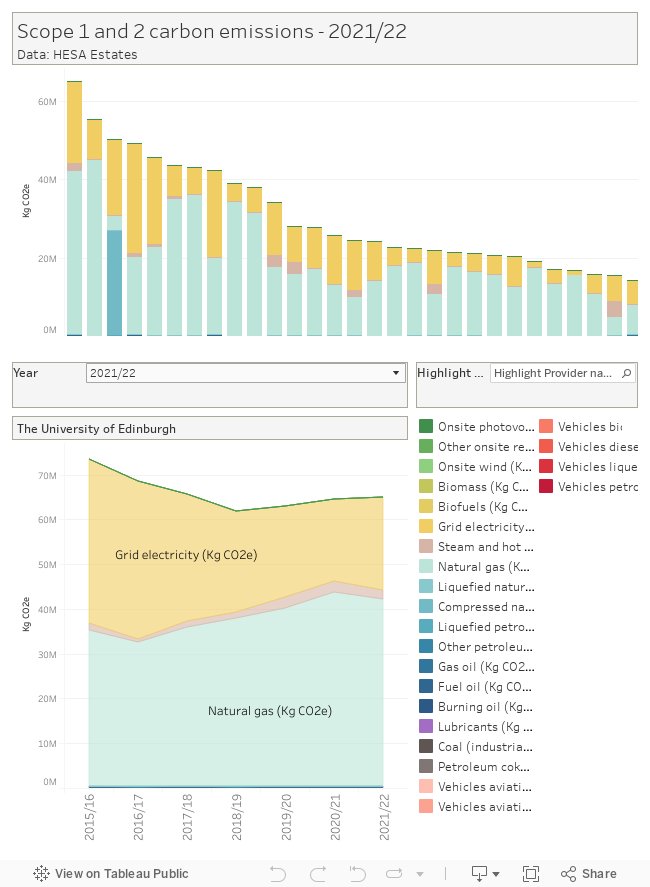
But what about Scope 3. This is the big one – the emissions associated with the supply chain. Emissions made by suppliers, and customers, are usually around 70 per cent of total emissions in the commercial sector. And as well as being harder to control, it is harder to measure – as seen in the wide variations among data provided by different providers over the years in question.
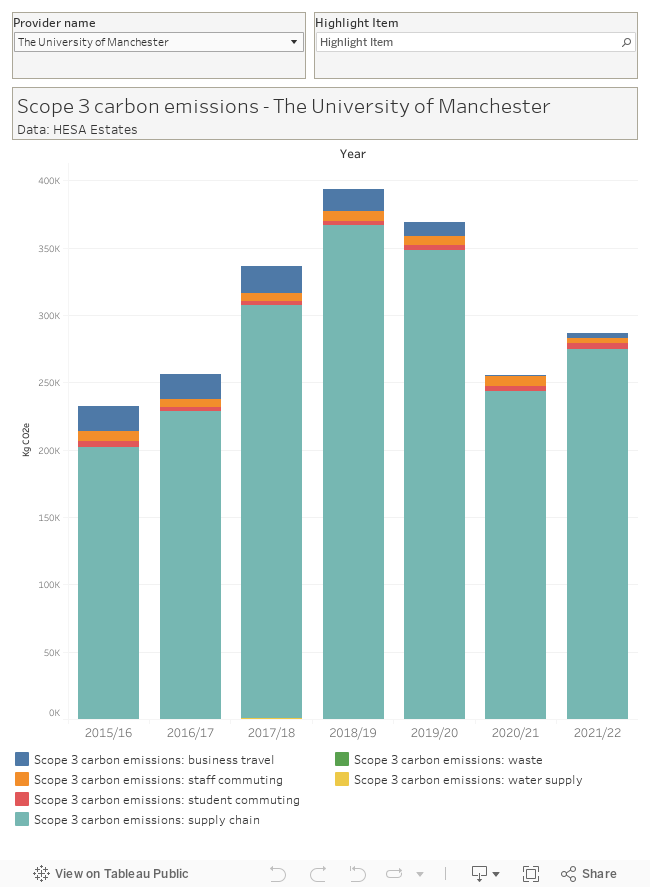
For this reason, I’ve included a by provider view only – it doesn’t make sense to rank where the content of submissions is so variable.
Clearly, there’s a lot of work to be done here – both in reducing and controlling emissions and in collecting the data. Providers will be reporting against the SEF by 2024 using the terms and definitions in the DfE Sustainability and Climate Change Strategy – AUDE, EAUC, and others will be providing advice and support.
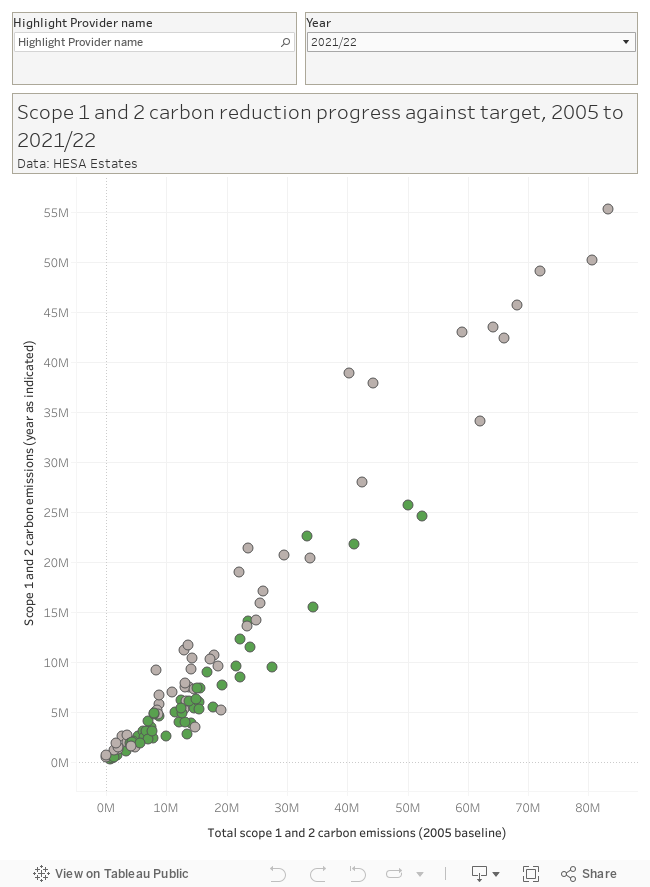
It’s instructive to recall that providers in England set proportional targets for reductions by 2020 for Scope 1 and 2 reductions back in 2007 starting from a 2005 baseline. There’s been a fair amount of success based on this old HEFCE mandate – and indeed the last time the OfS board discussed this issue the success of this approach was noted. Indeed the board instructed OfS to consult on the collection of emission data, require providers to set net zero targets for 2050, and publish information on progress. One to take another look at, especially given the chair’s reported interests in the energy industry?
I’ve plotted the 2005 baseline for Scope 1 and 2 against the value for the most recent year – you’ll see many providers have either met (55, shown in green) or are approaching their target. An impressive achievement, especially given the expansion of the sector estate during this time – and testament to the hard work of estates teams.
I always wanted you to go into space, man
Space utilisation surveys aren’t sexy. But premises are both an initial investment and an ongoing one – and the HESA Estates data allows us to generate a derived metric to explore income per metre squared.
What’s fascinating about this is that it offers a position on how sustainable the current estate may be (is it generating enough money to maintain?) and how well it is being used to generate income. Of course, not all money-making activities rely on campus space, and there are the usual skews towards smaller providers with research income. Even so, hats off to the University of Suffolk on this measure – the size of the estate has stayed fairly similar but income has grown substantially.
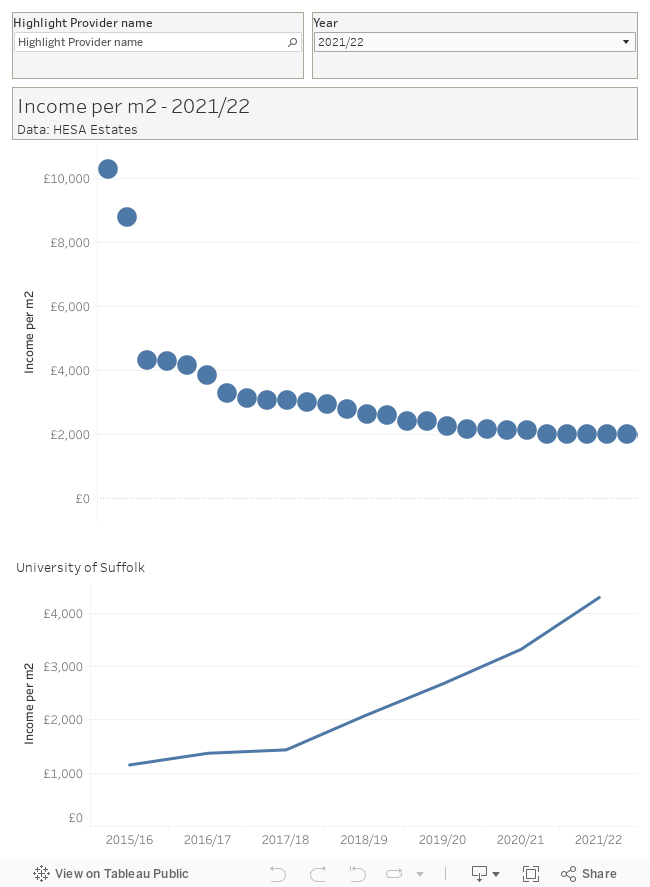
One fly in this particular ointment is that HESA only publishes the gross internal area – which includes things like corridors, toilets, and certain kinds of cleaning cupboards. It makes for a less satisfying calculation – but raises the question of how much money your toilets really make for the university.
On a linked and slightly tongue-in-cheek note, we can also examine which universities have the largest buildings (non-residential m2 versus number of non-residential buildings). Here we can see an interesting “London effect” in that providers based in the capital tend to have fewer larger buildings, whereas rural providers are more likely to have many smaller buildings. One provider that has recently developed an entire new campus – the University of Northampton – sits in the upper mid-table. Are big buildings cool? And who could fail to be fascinated by the 443 buildings owned by Aberystwyth University (average size 381 metres squared – a little bit bigger than a basketball court).
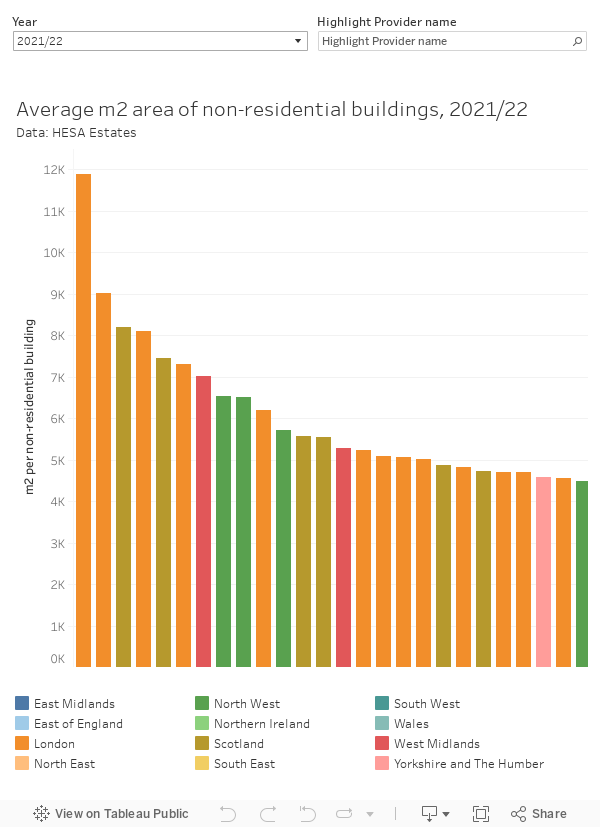
This, as I am sure you will agree, is fascinating in itself. But the ongoing controversies that surround campus dimensions – are we spending too much money on buildings? do we have enough space, and the right kind of space, for our students? do we have the right kind of campus space for staff to work in while staff are spending more time working at home? is a building the size of a basketball court the best use of resources? – suggest that these are hugely important issues, and that we need accurate data to help us make the right decisions.
The golden age of estates data?
We’re long overdue a reappraisal of the HESA estates data collection. Long regarded merely as a source of niche university rankings, it is a fascinating insight into one of the most important – but least understood – pieces of infrastructure that makes any university viable.
The coming of a stripped-down data set will hopefully drive data quality and responses back up – and on emissions data OfS really needs to grasp the nettle and make this mandatory. After all, golden ages don’t have to be in the past (as someone once said).


Thanks for highlighting the importance of scope 3 (supply chain) emissions David. It’s often overlooked as being too large to conquer. We’re really proud of what we have managed to achieve in this space, and we realise the importance of collaboration and sharing in this challenging area: http://www.ntu.ac.uk/about-us/news/news-articles/2023/06/nottingham-trent-university-launches-pioneering-net-zero-carbon-supplier-tool-to-he-sector
“One fly in this particular ointment is that HESA only publishes the gross internal area – which includes things like corridors, toilets, and certain kinds of cleaning cupboards. It makes for a less satisfying calculation – but raises the question of how much money your toilets really make for the university.”
This is a strange remark. There was a big festival this weekend. Could it have taken place without the toilets?
Suggesting that the supporting infrastructure can sensibly be overlooked is rather like saying the feed for that chicken cost 1p yesterday, how come I have to pay 30p for an egg in my local shop?
Providers also return “net area” – which is a standard widely used in similar calculations in the commercial estates sector. The definition is taken from the Royal Institution of Chartered Surveyors.
As I understand it, you can assume a certain “overhead” of service space per m2 of actively used floor space.