


Lighter evenings bring a sense of movement at this time of year – winter is clearly receding and more flowers are beginning to open.
Early February also means my birthday (the 9th, thanks for asking), and – in HE data circles – the release by HESA of more detail about students in higher education.
This week HESA completes its analysis of data about students in 2018-19 – we saw the raw figures in early January, and added alternative providers last week. There’s two weeks of performance indicators on the way, but for now we ask the traditional questions of the full open data release.
How your provider and subject is changing
January’s headlines about the University of Sunderland came as how subjects become unviable at providers. For all that providers are proud of their niche subjects, and keen to preserve their (regionally, nationally, or globally) distinctive offer, there’s little arguing with a dwindling student body.
First up, I wanted to let you look at the ebbs and flows within a single institution – a university may be growing, but where is the growth happening. This graph shows changes in student numbers (all modes and levels of study) over five years for each provider as an area graph.
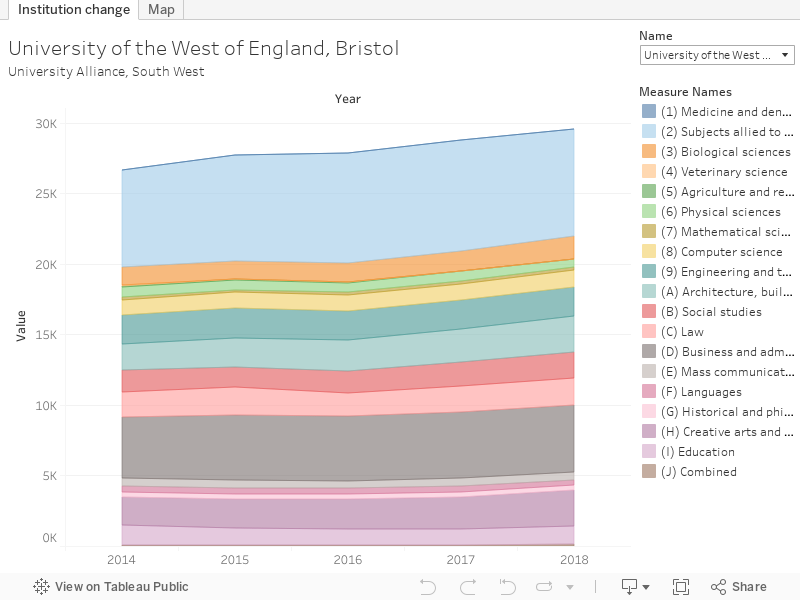
In our example we see the Creative Arts as an engine of growth for the University of the West of England.
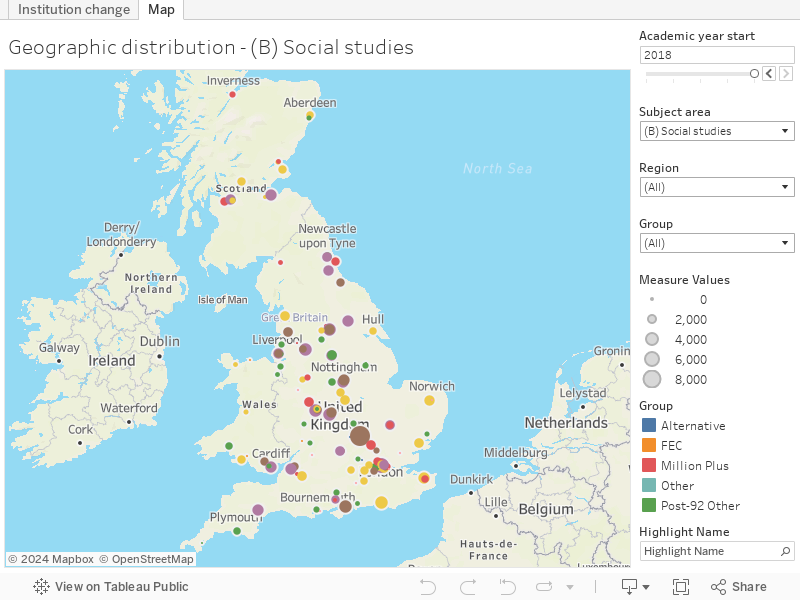
I’ve also plotted this top level of subject geographically – we note for instance Agriculture is primarily taught in the west of England at three specialist providers: Hartpury, Harper Adams, and the Royal Agricultural University. Thinking about regional industry I’m surprised to see so little provision in Devon and Cornwall, the East of England, and (especially) Yorkshire.
You can dive in up to principal subject level – I’ve done languages for the most recent year as it seems politically apposite right now. There’s always a bit of confusion about this category as it also includes literary studies (such as English and American literature) – I’ve removed some of the most obvious non-languages from the charts. The chart is probably most useful, get busy with the mouse-overs and filters and find – as I did – that you can’t study Scandinavian Languages outside of four UK providers (three of which are in Scotland).

Where students live
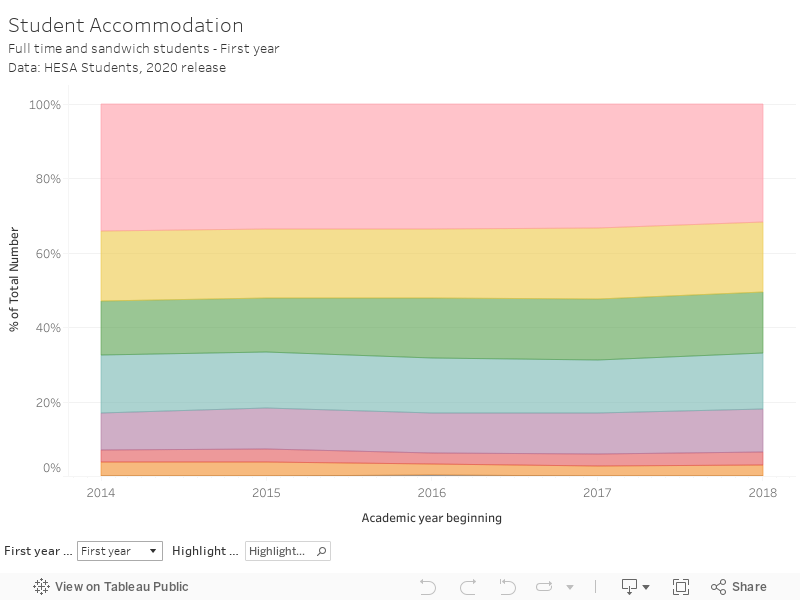
This is the first year in which more students live at their parental home than in provider-owned halls of residence. HESA highlights the rise in students living in private halls – up 7 per cent for last year. Overall most students live in the traditional “other rented accommodation” – though, even given a significant fall this year, first years are more likely to be found in provider maintained halls.
The Oxford Brookes graph
Anyone who has ever looked into the UK transnational education market is aware of how massive the ACCA BSc Applied Accounting course, validated by Oxford Brookes, is. This provision – to nearly a million students globally – dwarfs other initiatives.
But there are other stories in the data. The University of Chester is – via collaboration – a major provider of higher education to the Channel Islands and the Isle of Man. Heriot-Watt University delivers more transnational taught masters than any other university in the UK. Nottingham’s investment in overseas campuses makes it the most likely provider of transnational research masters courses.

Data notes
We’ve started to get longer time series, which is great, but some of these make for some unwieldy data releases. I know it isn’t a tool for serious analysis, but when you get to the stage that a tabulation won’t fit into Microsoft Excel you are actually going against the ethos of open data – that it should be accessible and usable by the general public. Perhaps splitting full time and part time figures, or undergraduate and postgraduate numbers, would help. It’s undeniably pleasing to have multiple options on a single visualisation, but some times you are better off with more charts and less filters.


The TNE graph shows over a million students for Oxford Brookes – what does this include? Looking at the data on the HESA website, I can see the total students for 2018 was 666,815 and about 39% were registered at Oxford Brookes?