


It’s a depressing reality that, on average, women are paid less than men. Yet it is still real issue, and higher education is far from immune. Why that remains the case – and what best to do about – are tricky questions.
There are a number of issues conflated within the headline figures: the straight-up legally actionable (since 1970) inequality of different rates for the same job; the differences in career trajectories that exist between men and women and how these are compensated for in pay and promotion; the lingering suspicion that “woman’s work” (often a great deal of gruelling emotional and organisational labour) is not appropriately valued; and the tendency for women to be over-represented in part-time and lower-paid roles while men are more commonly found in better remunerated jobs.
Understanding the scope and nature of the issue is not going to solve it overnight, but it is a valuable first step. Sunlight, as the saying goes, is a great disinfectant – you can be sure that organisations shown to be underpaying women will be looking to rectify the issue in the face of significant popular disdain.
What is gender pay gap reporting?
Since the 5th of April 2017 it has been a statutory requirement for all employers with 250 or more staff to publish data about six different pay calculations every Spring:
- Average gender pay gap as a mean average
- Average gender pay gap as a median average
- Average bonus gender pay gap as a mean average
- Average bonus gender pay gap as a median average
- Proportion of males receiving a bonus payment and proportion of females receiving a bonus payment
- Proportion of males and females when divided into four groups ordered from lowest to highest pay
Public sector bodies have a slightly earlier deadline and must comply with the public sector equality duty, but essentially comply in the same way as charities and businesses.
That information must then be published on the employer’s website and by the government. The data collection and reporting is overseen by the Government Equalities Office (which is part of the Home Office), where you can search for individual employers or download the latest data in one go. According to the Home Office it takes up to an hour for an employer’s online submission to be published, making the data almost live. However, as this is new, self-reported data, it’s currently very “dirty”, requiring significant cleaning-up before analysis.
Employers can also choose to publish an accompanying narrative, including challenges they face, successes they’ve had, and planned actions to close gaps.
Failure to report the data is an “unlawful act’ and the Equality and Human Rights Commission (EHRC) can take enforcement action, with penalties including an unlimited fine (see s34 of the Equality Act 2006). They may start an investigation if they suspect an employer is hiding a pay gap. Over 10,000 employers submitted data, with about a tenth doing so on the last day. The Commission said that 1,557 employers missed the deadline and that they will start by writing to each of them for an explanation within 28 days. Terms of reference will then be issued (publicly) for any enforcement processes. The reputational risk to employers that don’t comply, or those that have large gaps, is high.
It’s worth noting that HESA already collects a wealth of information about higher education sector staff, including pay, but it is not currently open data, and is not offered at an institutional level without payment.
Our data
As above, this is very early days, and the data is pretty dirty. In particular, coding to SIC (Standard Industrial Classifications) codes is very unreliable. Despite the existence of specific codes (85421 and 85422) for undergraduate and postgraduate tuition, these are not reliably used. Some institutions do not use any code at all – others a miscellaneous variety of labels seemingly applied at random.
To generate our list of higher education providers we had to rely on human judgement – using searches to the two identified codes, alongside general searches on the terms “university” and “college”, plus cross checking with existing lists. As it stands, we’d be surprised if we captured everything (we’re notably low on institutions based in Wales and Scotland) but we did get most of it, using the data as it stood on the afternoon of April 6th, 2018.
One interesting artefact of this manual process was that we could pick up related organisations (everything from Students’ Unions, to traded services, to Oxbridge colleges). We’ve omitted these from our main visualisations, but they are there and can be added back (or viewed seperately) if you choose via the “groups” drop down. The size of employers is a hugely important factor in pay differential, so you can filter by size as well.
There are six visualisations, accessible via the tabs at the top as follows:
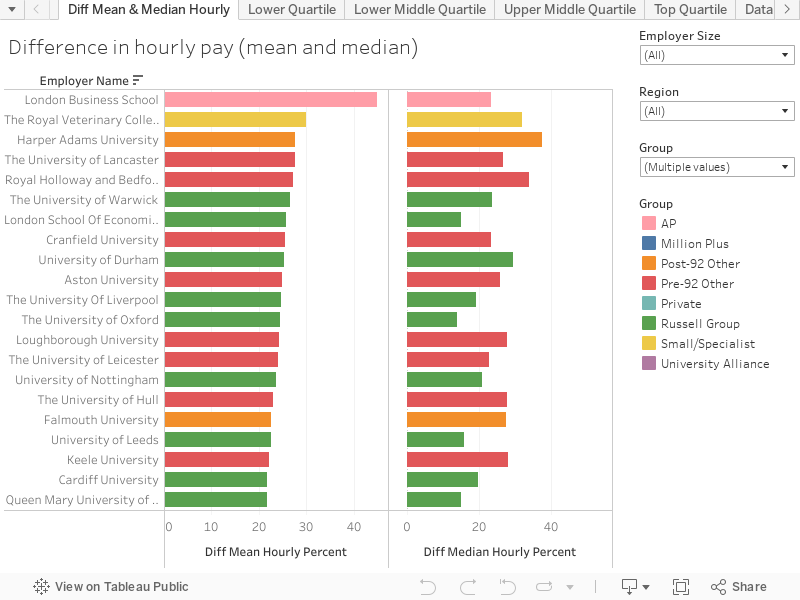
- Difference in hourly pay – mean (left) and median (right) values. The figures relate to the average percentage difference between the pay of male and female employees. The colours related to groups of institutions (mission groups and other distinguishing features).
- The next four show the number of men and women in each quartile of an institution’s salary range. Women are always on the top of each bar, and each bar will add up to 100% – we’re not sure how non-binary people are registered in these statistics, but that’s a bigger discussion.
- Data by institution or group allows you to filter the data accordingly. You can use the controls at the bottom to select what you want to look at.
As always with our Tableau visualisations, you’d be best enabling full screen mode (the icon at the bottom right).
What they show us
Across the whole sector, men are over-represented in the top quartile, while women are significantly over-represented in the bottom quartile. This pattern holds for all groupings apart from the students’ unions we have data for.
The Russell Group and other pre-92 institutions are likely to have a greater mean difference in hourly pay than other groupings – probably due in part to them being larger employers. However, there are no clear grouping predictors for the median difference – institutional size and structure may play more of a role here.
Only four institutions have more men than women in the lower quartile of pay, whereas 30 have more women than men in the top quartile of pay. It is heartening that some women are beginning to reach higher levels of pay (though there is still a way to go), but we should be seriously concerned about the numbers of women amongst the lower paid of the sector.
According to our analysis the median HE-sector pay gap is 16.32%, compared to a gap of 9.7% across all employers. Whatever way you cut it, that is not a good look.
What can employers do about gender pay gaps?
Official guidance about what employers can do about gender pay gaps is provided by the Advisory, Conciliation and Arbitration Service (ACAS). In HE, Advance HE, unions, and employer associations also have a wealth of guidance available, with some details of the latter provided in UCEA’s article on Wonkhe.
Some of the solutions include using training and institutional processes to tackle all forms of bias at different career stages, promoting flexible working practices, as well as tackling any pregnancy or maternity pay discrimination. Shared parental leave is another area that could lead to improvements.
The top-level pay gap data, and much of the accompanying commentary, has been relatively blunt. However, this new reporting requirement has clearly helped to raise the profile of this issue and should encourage all employers to understand and tackle any pay gaps. There is an opportunity for individual HEIs, as well as the sector as a whole, to demonstrate leadership, not only with their own employment practices – but in how they conduct teaching and research. Educational institutions have a unique capability to address gender issues, including pay. Those institutions named and shamed in the press for large gaps have signalled that they recognise the issue, the question now is whether they can show progress by the time the data comes out next year.


What sort of pay range and roles are we talking about regarding each quartile, and where do the standard admin roles sit?
Hi Peter – it will be different for each institution. The lowest quartile, for instance, is just the bottom 25% of salaries at a given provider.
“As it stands, we’d be surprised if we captured everything (we’re notably low on institutions based in Wales and Scotland) but we did get most of it, using the data as it stood on the afternoon of April 6th, 2017.” – I assume you meant 2018!
Thanks; interesting and very useful info as usual.
There are several factors – not just in the HE sector – that persuade me that the ‘gender pay gap’ is not an issue, and is being hyped up to suit an agenda . It is illegal to pay people differently if they are doing the same job – if people are doing different jobs that’s a different matter – and who determines ‘value’. If a dinner lady wants to earn the same as a bin man then she should apply for that job, and spend all day running around humping heavy loads.
“Men are over-represented in the top quartile of salaries, while women are significantly over-represented in the bottom quartile” is likely because the upper quartile is mostly populated by people who have been in their career for some time, so its a representation of the past not the present and will even out over time. That’s why most senior judges, are men – it takes a long time to get to the top, and these people started their careers a long time ago, when there was real discrimination and fewer women making the starting line. Now women are free to make different career choices – take time off for family, select roles where is more work-life flexibility, less travelling, no evening meetings etc. There is nothing stopping any woman from doing anything she wants. If they want more money they should just apply for a different job.
Also – there are long term solid data on death by accident in the workplace – I believe that 99% of these deaths are men. Women *choose* not to take these dangerous roles even if they are better paid jobs. Where is the clamour for women to take their fair share of this workplace statistic?
Haha – yes we did! Thanks for picking that up.
Hi David, thanks for your reply.
I understand that! Just that if, as you say, “we should be seriously concerned about the numbers of women amongst the lower paid of the sector”, I want to know which roles this refers to, to know exactly what I/we should be concerned about.
Is this data showing us a predominance of females amongst cleaning staff? Or, if the lower quartile includes your general UG and PG administrative type roles, is it just showing us (the obvious) that these roles are largely occupied by women?
I’m wondering to what extent the data is simply telling us that the HE sector is dominated by women until you reach the highest rungs of the pay scale / administrative hierarchy?
Or, alternatively, thinking about the methodology, is this data showing us that lower paid women are more likely to self-report their pay when surveyed on gender pay gaps? It’s possible!
So, overall, it’s really hard to know what to make of this without the actual detail!
ugh I couldn’t disagree with you more.
Thanks for these interesting insights and also to Andy Fryer for his perspective (9th April, https://wonkhe.com/blogs/tackling-the-he-sectors-gender-pay-gap/).
I fully endorse Andy’s suggestion that ‘if journalists took time to read the gender pay reports that HEIs have provided, they may discover a new honeypot to report on’, in terms of the positive gender pay gap action planning and interventions being taken.
Interestingly, this is a route I have been considering exploring myself, with a view to getting a better understanding of the actions that institutions are taking to address their pay gap, as well as any interventions they have already taken that have worked, and could be successfully replicated. Separately, I’ve been doing a lot of work myself around female academic progression in particular and recognise the complexity and the interrelation of issues that affect this.
Before I spend (however many hundred weekends!) manually locating and reading every HEIs report based on the list of employers that you’ve helpfully drawn together in this article, I wondered if you were already aware of anyone undertaking this type of analysis?
LBS isn’t an alternative provider – it’s part of the University of London.
https://london.ac.uk/london-business-school
http://www.hefce.ac.uk/workprovide/unicoll/heis/#letterL
Hi Brian
The University of London is a federal university comprising 17 colleges directly funded by HEFCE. All the colleges run independently and therefore report their gender pay gaps separately. These are listed alphabetically in the list of HEFCE-funded higher education institutions and are marked with an asterisk.
My point is that it’s an HEI not an AP so shouldn’t be pink.