


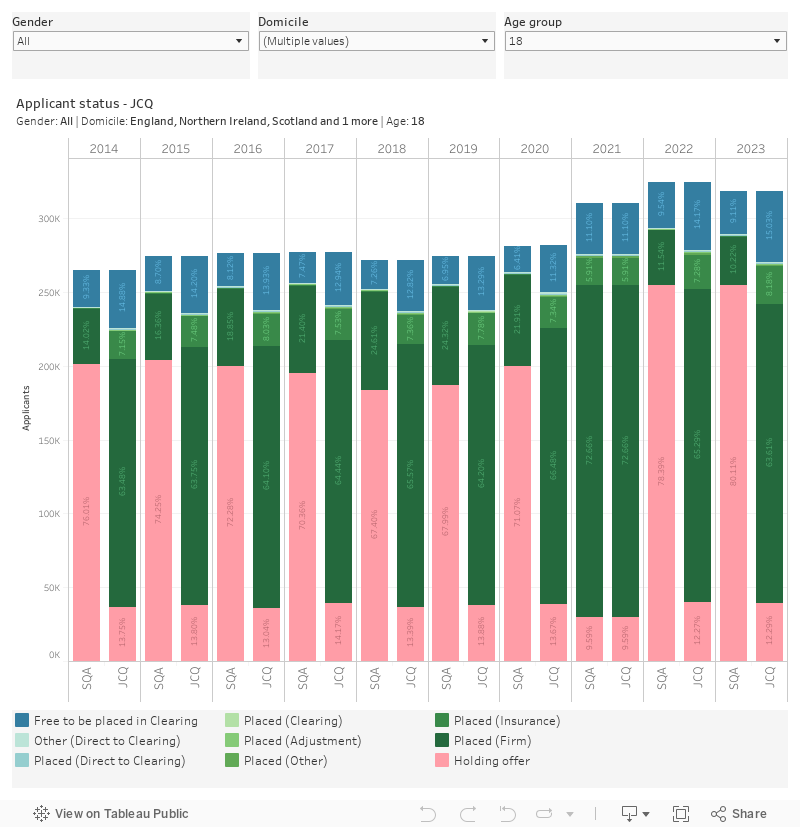
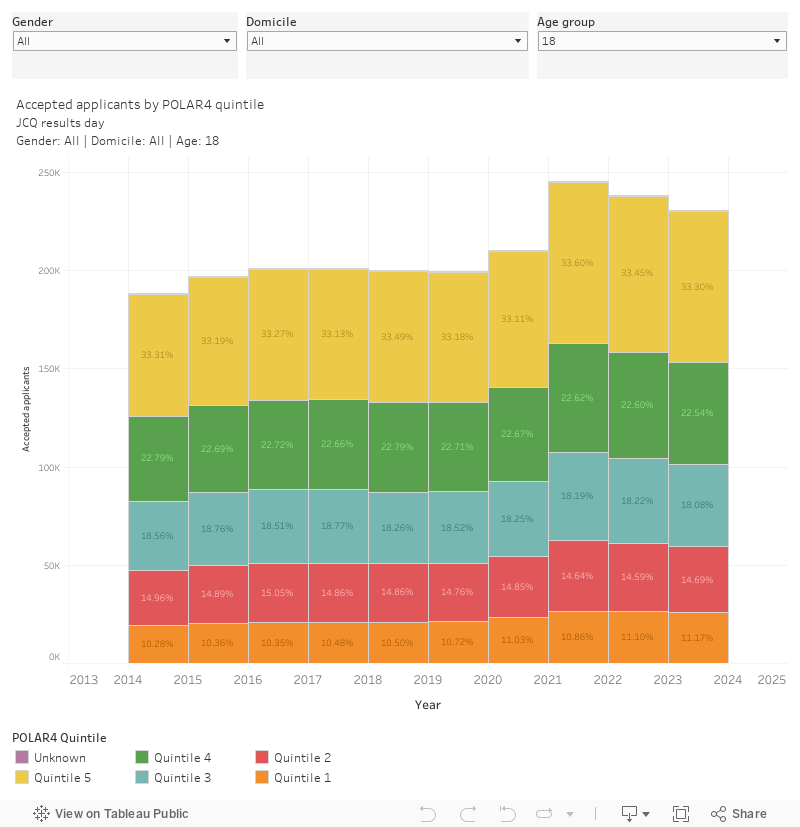
Both the number and proportion of 18 year old UK applicants who have taken up their firm university place on A level results day is down slightly on last year, but the number is up substantially on 2019.
This follows results in most A level subjects returning to the proportions that defined the previous decade – with performance as expressed by grades completes the movement away from the peaks we saw during pandemic restrictions. Proportionally, there are less UK 18 year olds currently accepted at their “firm” choice than in any year since 2014 – indicating the potential for a busy clearing (A record 15 per cent of UK 18 year olds in the system are free to be placed in clearing).
Update: Busiest clearing on record
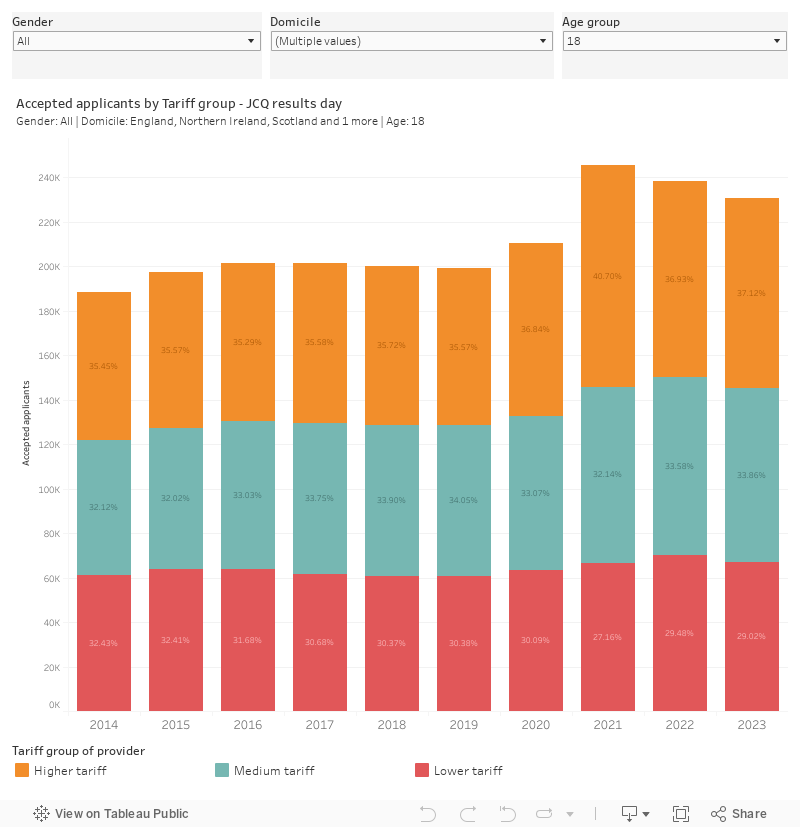
The number of 18 year old UK students accepted at “high tariff providers” (those who require good A level scores or similar for entry) is down for the third year in a row, though again is up on 2019.
Here’s a plot of current applicant status for you to explore, showing both JCQ (England, Wales, and Northern Ireland) and SQA (Scotland) results days. You can filter by age, domicile and gender.
Why 2019?
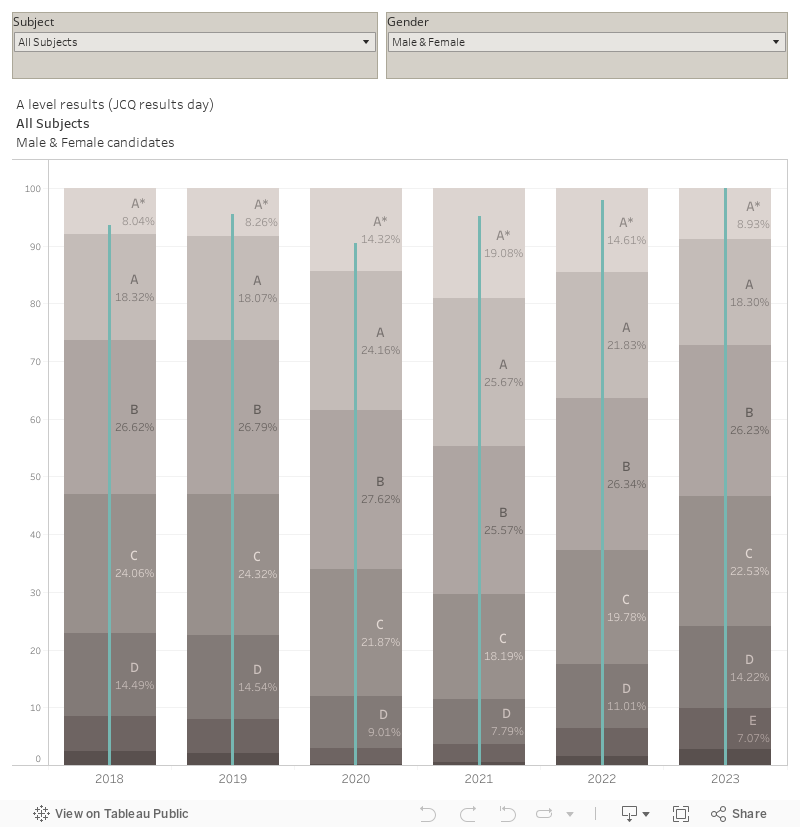
A level and Scottish Higher results in 2020, 2021, and to an extent 2022 were a departure from a grade curve established in 2010 and maintained for most of the preceding decade. After the 2021 results were published ministers decided to instruct Ofqual to ensure that grade returned to “normal” levels. This was achieved by moderating grades in 2022 and 2023 (with approximately half the total “excess” reduced in each year) meaning that results this year have been designed to be directly comparable with 2019 and previous years.
This plot shows A level results since 2018 – you can see that this aim has largely been achieved (though there are slightly more A* grades overall than you might expect). You can filter by subject area (the default is all subjects) and gender – the thin turquoise line shows the number of entries in each year.
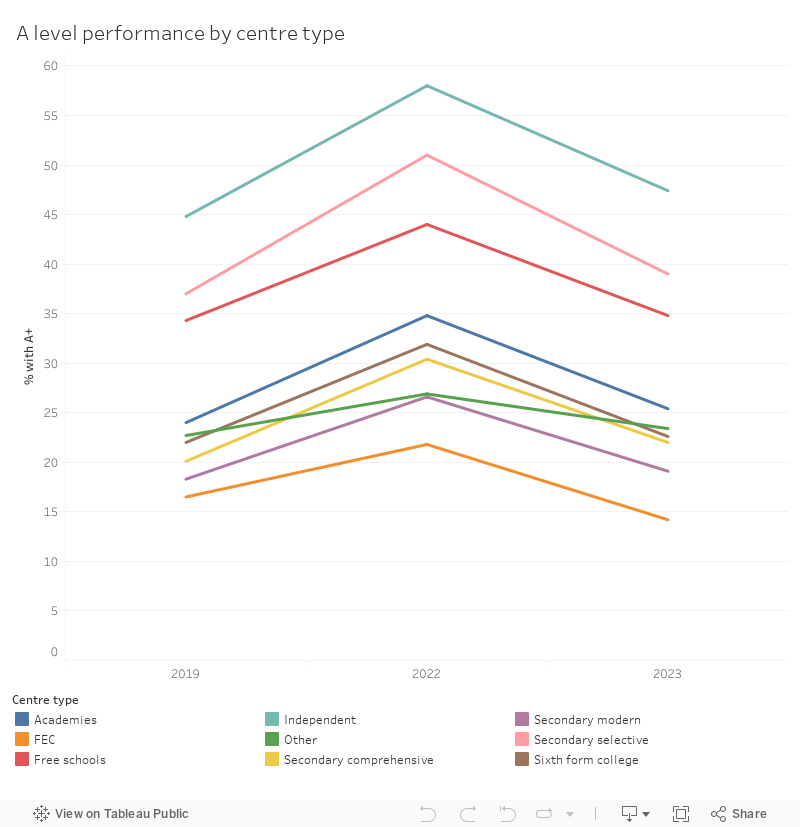
Data from Ofqual this morning shows that this reduction has been achieved while maintaining the standard differences between types of school. There was a lot of concern during the pandemic years that students at private schools were being unfairly advantaged by teacher-assessed grades. This chart should reassure you that private school pupils have that advantage every year.
The university response
As I’ve been over on the site before, each university or other higher education provider has its own admissions strategy, based on the number of applications it receives and the number of students it can admit (based on physical or other capacity constraints). Higher tariff providers tend to be more able to manage recruitment to ensure they remain the optimum size while recruiting students who would benefit from the style of teaching they offer.
As you’ll see from this chart, the overall number of UK 18 year old students holding places on JCQ results day is down on the previous two years, although after a fall last year the proportion holding places at high tariff providers has risen very slightly. Again, we should note that this is a return to 2019 proportions.
During the pandemic usual offer-making behaviour was disrupted by higher-than-expected grades – usually selective providers make more undergraduate offers than they expect to admit, aware that many students will not achieve their predicted grades, but in 2021 (and to an extent in 2020 and 2022) more of these needed to be honoured. The knock-on effect of larger than expected cohorts also put constraints on total capacity for future years.
International student intake is the other big question – increasingly international fees are a big part of what makes many universities viable. We see a numeric growth but a proportional decrease over last year in international students placed at their firm choice. There are, however, record numbers of international students free to be placed in clearing at this point in the cycle. Accepts overall are again down on the 2019 peak (71.1 per cent of these are in places at high Tariff providers, a non-pandemic record proportion)
In terms of widening participation – the changes are small but in the right direction.
Expectation management?
It’s fair to say that everything has turned out as was expected – there’s no big shocks in this years results or in the way that universities have responded, just lots of hard work by all kinds of people. We have, for better or worse, returned to the old normal – with the “old” imbalances and unfairness baked in – and until we see a more radical policy approach to university admissions and the way compulsory education ends with a handful of very specialised high-stakes exams this is where we will stay.
There will be commentary that suggests that a drop in university placements (or, more likely applications) suggests declining fortunes for higher education. It seems unlikely – we are back on the demographic-led pre-pandemic track, and had it not been for two bumper years (plumped by a lack of opportunities to work or travel) we would be celebrating a record year for the sector.
More A level charts
I thought I’d include a couple more ways to look at this year’s A level results, to help put this year into context.
This first chart shows the number that sat each subject as the size of each dot, and allows you to select a grade (single or cumulative) and filter by gender.
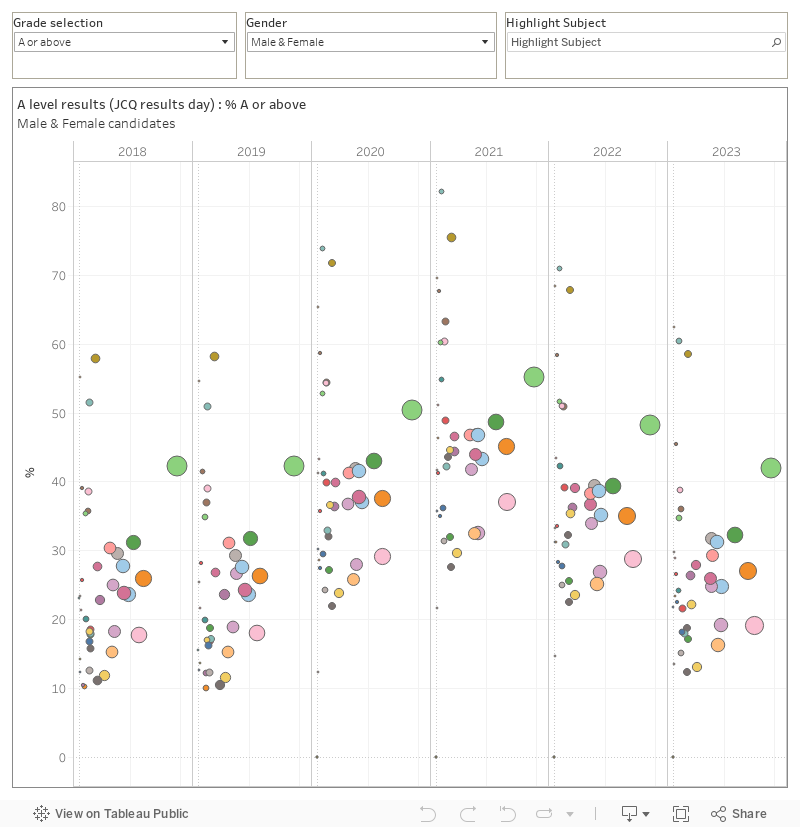
I designed this to help see subjects in comparison, as it is striking to note that “easier” (more likely to get a higher grade) and “harder (less likely) subjects have stayed broadly in proportion to each other during the pandemic years.
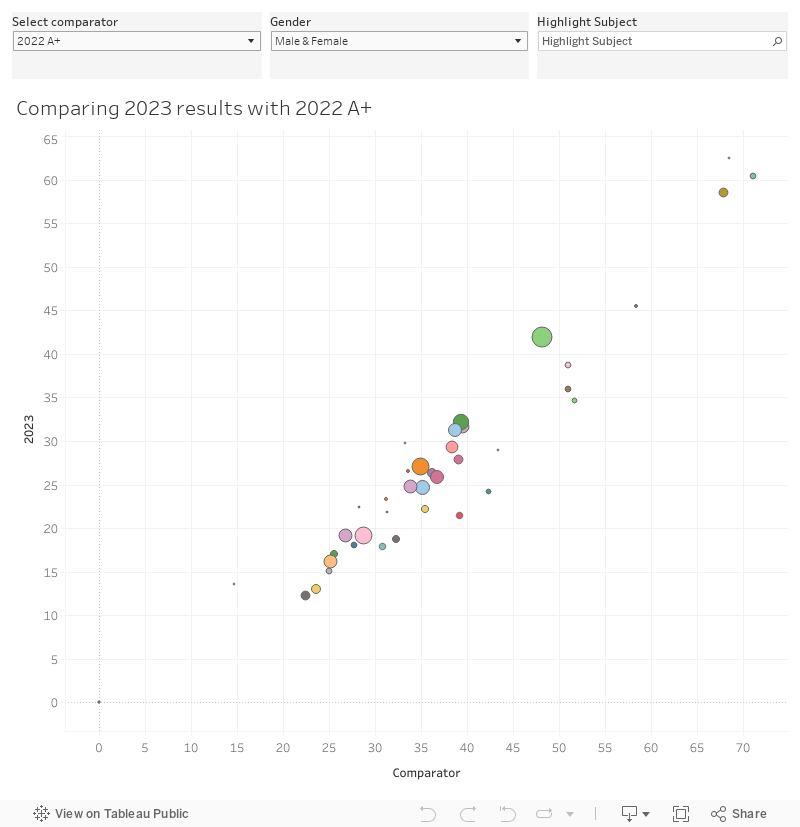
I’ve also built a dashboard to help you compare this year’s results with both last year and 2019 on a scatter plot. You need to change the “select comparator” parameter – the 2023 figures will automatically switch to the appropriate grade.
Masterclass analysis! Thanks