

New Census data on qualifications, industry, and location
David Kernohan is Deputy Editor of Wonkhe
Tags
The Office for National Statistics has been digging further into the mass of data collected during the 2021 Census in England and Wales.
Here we’re looking at the proportion of the workforce in a given industry with a higher education qualification, and this is available at a lower tier local authority (LTLA, sometimes known as “district councils”) resolution.
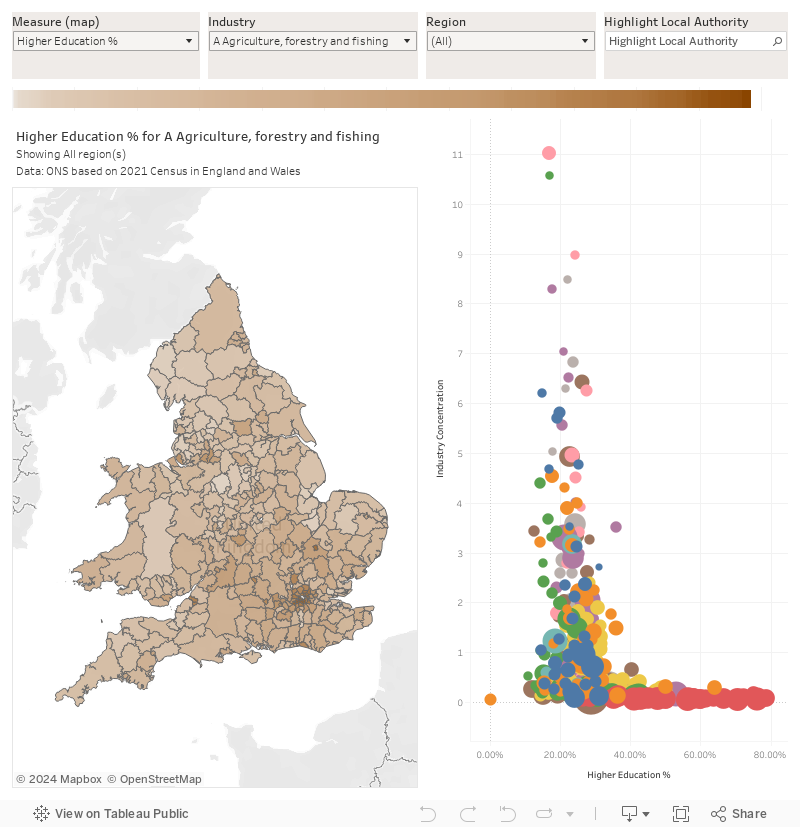
On the map the density of the colour shows the proportion of the workforce in the selected industry with a higher education qualification (you can flip this to look at the proportion without a HE qualification or the proportion of the overall workforce in each area using the measure control). The scatter plot on the right plots the proportion with a HE qualification against the “industry concentration” (an ONS-developed measure where a value of one means a local authority means it has the same concentration of workers working in that industry as in England and Wales as a whole – you can see this on the map too with the measure selector but the colours invert due to Tableau strangeness).
In higher education data, we can often be frustrated when providers are measured on student outcomes without reference to either the overall make up of the local workforce or the industries that dominate. Many graduates choose to remain in the area in which they studied (or were recruited from) and we know this has a limiting effect on the type of work they do – a negative outcome for the provider they studied at, but a like positive outcome for an area and indeed the graduate (if you take wider quality of life into account).
When we look, as we must, as the distinctly broad brush graduate job definition that the Office for Students appears to feel is adequate for regulation (the first three SOC top level codes – managerial, professional, associate professional) we can see from the plot above that some industries just have less “graduate jobs” in than others. If a number of your graduates are moving back to, say, Powys they will find plentiful (and meaningful) employment in agriculture – in fact this may have been what they trained for at university.
However, the nature of this industry means such work (carried out by around 16 per cent of graduates that live in Powys) is unlikely to fit into the value-laden definition of what a “good destination” might be. So what should you do? – not teach agriculture? Forbid graduates from moving to Powys?
I don’t think we were running short of indications that using SOC codes to identify “good” graduate jobs may not be the most optimal way to regulate higher education providers (especially specialist providers in unfashionable subjects) – but this is clearly another meaningful entry in that growing list.
*cough* SOC not SIC – if you don’t like SOC as a metric, then be grateful that at least we’re not using SIC!
This is not, btw, a challenge for wonks to find a way to use SIC in metrics.
Yeah – sorry – SIC/SOC error now fixed.