

Are graduates happier when they return home to work after study?
David Kernohan is Deputy Editor of Wonkhe
Tags
It’s one of the key data points concerning university claims towards a civic mission.
Call it, if you will, the “Cotton-eye Joe” variable – where do they come from (your students), and where do they go (your graduates)?
It’s fine to make bold claims about providing opportunities for disadvantaged local people, but if they all then go to London to work some of the shine is lost. Likewise, your graduates may be driving innovation in local industry, but this plays less well if you’ve imported them all from the home counties.
Initial domicile, term-time address, and graduate domicile are all collected by HESA – and we see glimpses of each in current open data release. After HESA released table 59 of the student record in the week of my birthday last year (thank you!) we know to local authority resolution where students come from at each provider. ONS has documented the travails of understanding where students live in term time. And LEO data is used by OfS generate the geography of employment, which unhelpfully is provided at travel to work area (TTWA) resolution -. We also get initial and current domicile, by provider, in LEO, at regional resolution.
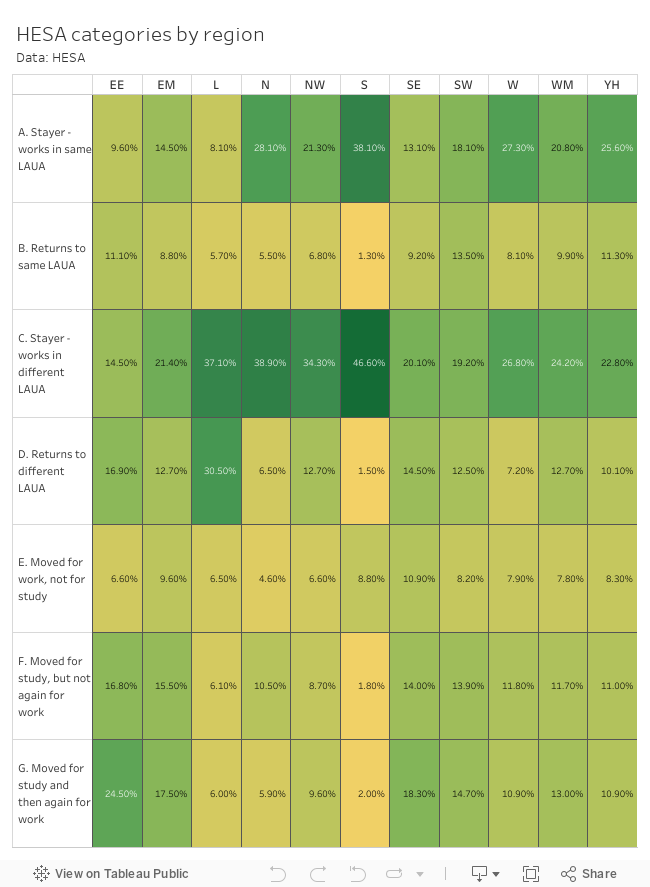
It’s all a little bit untidy, which is why HESA is stepping in to make something that promises to be a lot easier to use. We’re standardising on local authority areas, with NUTS3 regions as a higher order descriptor across the whole UK for the locations of original domicile, study, and work. Every graduate that gave an address to graduate outcomes (and answered the all important “graduate voice questions”) is included – some 279,000 graduates – and the new methodology adds them to one of seven categories:
- A: Same local authority for original and work, same region for study
- B: Same local authority for original and work, different region for study
- C: Same region for original, and study – different local authority in the same region for work
- D: Same region but different local authority for original and work, different region for study
- E: Same region for original and study, different region for work
- F: Same region for study and work, original region was different
- G: Different region for original, study, and work
For example, I grew up in Stockton-on-Tees in the north east, studied in Leicester in the east midlands, and 18 months after graduation I was working in Rhondda Cynon Taff in Wales – so I’d be in category G.
These categories are helpful in adding nuance to what we already know – for instance we know that 45 per cent of graduates originally live, study and work in the same region (categories A and C), but this analysis shows us that 60 per cent of these work in a different local authority to the one they originally lived in (category C). And for the 22 per cent of “returners” (categories B and D), 63 per cent end up working in a different local authority.
We get data on proportions in each category by region at this point (there will be more data to follow)
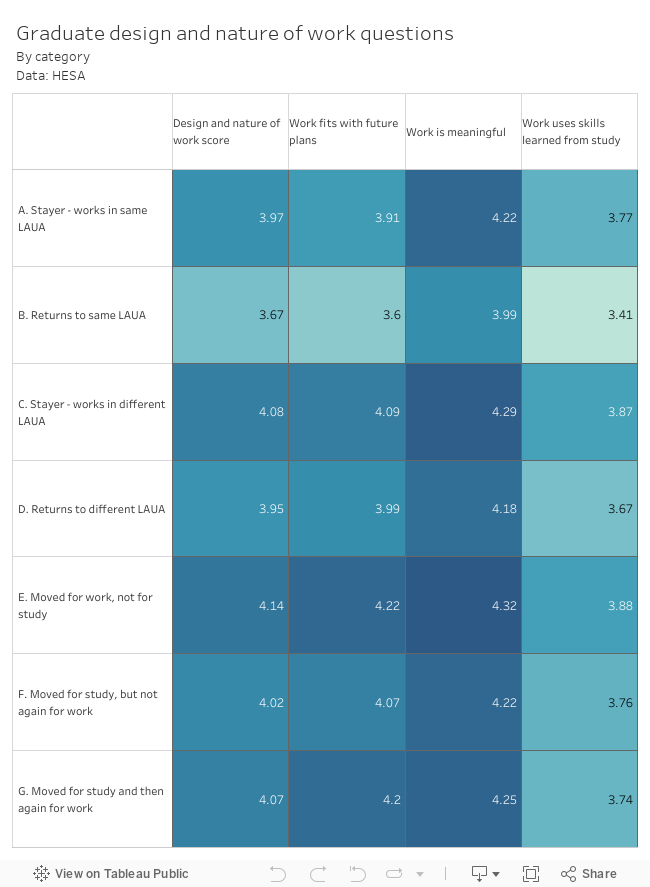
The real magic here will come when we can look at these categories against the full range of graduate outcomes data – so we can ask if “returners” are less satisfied with the work they do (it looks like this is the case here, in line with previous findings) and if those who move back to the same local authority (category B) have it even worse (they do). Imagine being able to do this by provider!
This is the answer to many questions about “brain drain”, the idea that graduates tend to do better when moving to London to work (and to study) rather than returning to the Welsh valleys (category F). It’s important stuff – and it is great that at last we might be able to analyse these phenomena properly.