


There’s a point in every debate about university finances where someone takes it upon themselves to argue that universities would be awash with cash if it wasn’t for an ever-growing army of pointless non-academics.
It’s both profoundly unhelpful and absolute nonsense. I’m not going to tell you what connects the kinds of people who make these arguments, but suffice it to say that they are generally not university administrators.
Wages – along with other employer-owned methods of establishing personal esteem – are an emotive subject at the best of times. During a sudden and startling rise in the cost of living, and during a long period where increases have not kept pace with inflation, it can feel very personal and very painful very quickly.
Facts and figures
To help us get around that, allow me to introduce you to one of HESA’s lesser known open data releases. The “analysis of staff costs” (Table 12, HESA Finance) gives us average full time equivalent (FTE) academic and professional staff, and the amount spent on salaries and wages for these groups, for each provider in each financial year.
From this we can very simply derive an average salary per FTE – which amounts to an average wage for academics and professional staff for the same provider each year.
Here’s a plot of that. The main scatter chart plots average salary per FTE for academics against average salary per FTE for professional staff. The size of the blob shows the total staff FTE for that year – you can choose your year via the filter at the top (but note there’s incomplete data in earlier years).
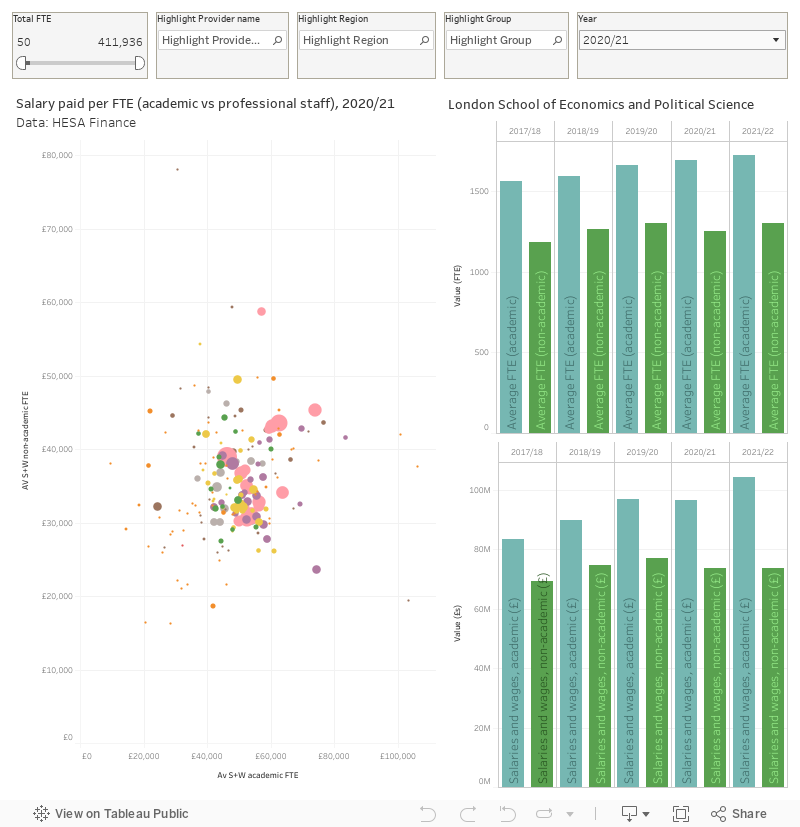
I’ve excluded two outliers (Oxford and London Business School) because I suspect there to be issues with the data. There’s also a global filter that excludes any provider with less than 50 FTE staff in total because you get odd results for small populations (you can add them back in using the filter at the top). Mousing over a provider blob (I suggest you use the highlighter to find your provider) shows year on year changes in the two bar charts on the right.
What we can learn
Here we are just talking about salaries and wages – not pensions costs or other on-costs related to employment. And because we are using FTEs we are just looking at providers in England (the data isn’t collected for Scotland, and collected in a different way for Wales and Northern Ireland).
The first thing to note is that, in most cases, it costs a lot more for a provider to pay the wages needed to employ an academic FTE than it does a professional staff FTE. Certainly, some academic staff are paid very well indeed, though it’s in the nature of means as averages that at least a similar number will not – and the aggregate data we are working with does not give us any information about the distribution of salaries within this.
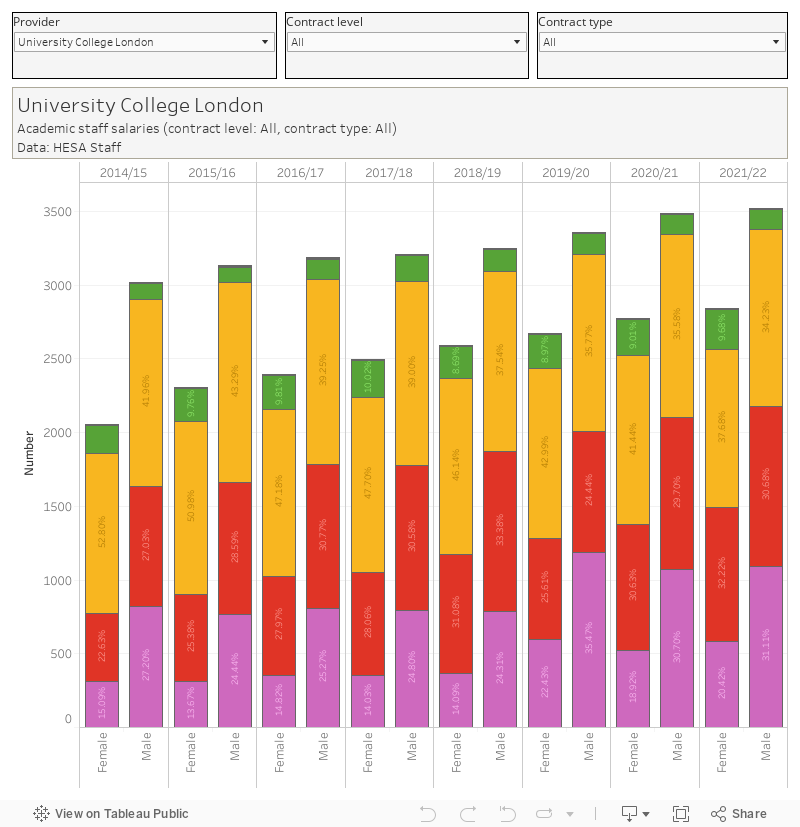
That said there’s some HESA Staff data I’ve plotted before that can give us an overview of the range of salaries paid to academics – with the constant reminder of gender differences in pay and the likelihood of employment.
More or less
In general, we can see larger and more traditional providers tend to employ more professional staff than academics, but have a higher wage bill for academics than professional staff. Numbers on both measures are much closer in some smaller more modern providers, likely because these are less likely to have academic staff with a research-only focus, and because the regulatory demands in England are such that there is a minimum number of expert professional staff needed to ensure the university doesn’t fall foul of them. Very small, specialist, providers tend to have more academic staff than professional staff.
As a side-quest here, I’ve included the (separately provided) FTE of staff (any staff, this time) earning more than £100k – this includes your friends in the senior management team, be they on academic or non-academic contracts, along with many senior and august professors in STEM subjects – in the tooltip. A glance at these numbers against the total numbers of staff and total salary bill should tell us that top end salaries have a negligible impact on institutional finances.
Poor rhetoric aside, what I get from this exercise is a sense of the huge numbers of people it takes to run a university, and the huge amounts that are needed to pay them. There are regional differences – salaries remain higher in London – but surprisingly few mission group differences.
David – I wondered if you were able to break your academic staff data down by subject as I think there might be some more granular differences between STEM, Social Sciences and Arts and Humanities?
Hi Diana – not by subject and provider! There’s a cost centre split on HESA Staff (DT025 Table 13) by salary band.
Trinity Laban £103k per academic FTE, £19.5k for non-academic FTE, but only 1 member of staff over £100k? That person must be on millions? (or there is something up with the data…)
Could you do no. of staff over 100k as a ratio of total staff (or students for that matter)? That would be interesting.
Also staff on 100k over time would also be interesting (not sure how far that goes back)