


When this year’s National Student Survey (NSS) results were published back in August, there was a predictable difference in interpretation between campus culture wars players over the free speech question.
For some, a national (England only) score of 86 per cent positivity on “During your studies, how free did you feel to express your ideas, opinions, and beliefs” was evidence that the entire agenda and associated legislation has been a waste of time – or at least exaggerated.
For others – like free speech bill architect Iain Mansfield – it was nothing to celebrate:
14% of students reporting they cannot speak freely is a significant problem. Just as any good employer would take 14% of staff reporting bullying, harassment and discrimination seriously… suppression of free speech / cancellation by its very nature impacts a minority of people. Those in the majority very rarely have their speech cancelled. But minority views also matter. And their freedom of speech matters.
Both in that thread and throughout the debates on free speech, the image that is invoked is that of a student that skews to the right on economic or social issues, but is cancelled by the “woke mob” or overbearing EDI work.
Hence OfS’ Director for Freedom of Speech and Academic Freedom Arif Ahmed’s view:
[Free speech] is literally there to protect minorities. Saying it is OK that self-censorship only affects a minority is like saying it is OK that poor healthcare only affects people who are unwell. But second – in what world is 14% an acceptably low figure? How can anyone be happy that 14% of those taking part in higher education are missing out on a fundamental pre-requisite of higher education?
Feeling free
But when we’ve polled students, we’ve detected other things going on – a general lack of confidence, for example, and evidence that has suggested that those with the characteristics that EDI initiatives tend to be aimed at are those who score lowest on the question.
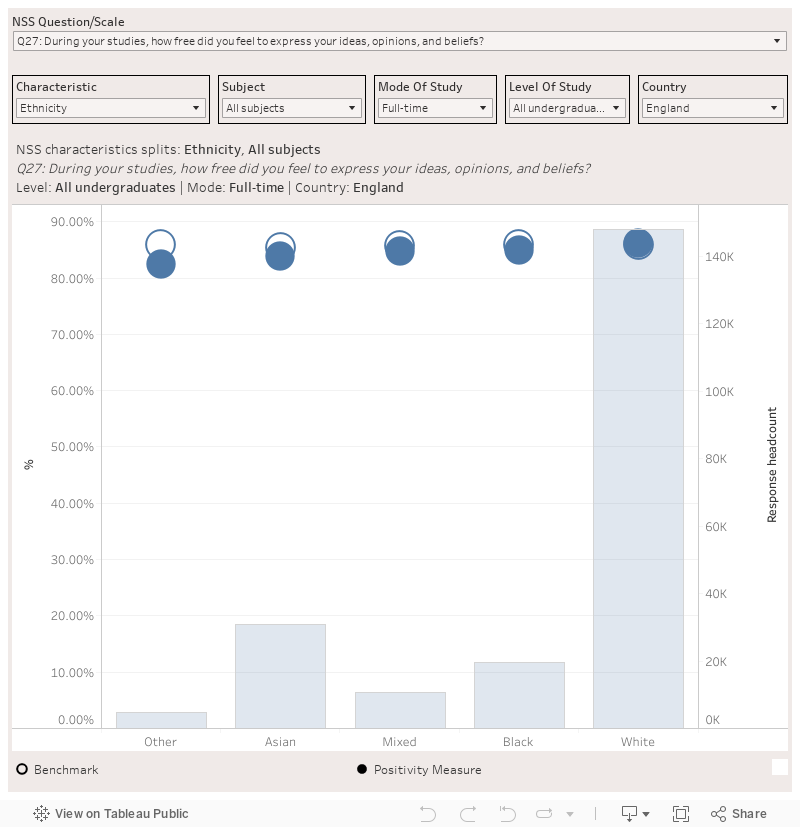
So the publication of NSS results by characteristic was always going to be an interesting moment. And guess what.
Students that aren’t white were less positive on the question, students from the most deprived areas were less positive, and those eligible for free school meals, those from the EU, Disabled students and care experienced students were also much less positive overall.
In other words, if the sector was to set out a national plan on boosting its Question 27 scores, it looks like more EDI work – of the sort frequently in the dock for chilling speech – would almost certainly boost it.
And as we noted a while ago, the qualitative comments we get when we ask the question in our polling suggest that meeting the new legal duty is much more about boosting confidence than tackling cancel culture. If one of the teaching quality questions was on opportunities to contribute verbally, I’d bet there would be a strong correlation here.
All of that said, even the top scoring splits are not above 90 per cent. The question is what you might do to cause both everyone to improve, and not ignore those with the lowest scores in the process. That requires work on why, rather assuming that the things in the Higher Education (Freedom of Speech) Act 2023 will make a difference – because without knowing, they could also make those scores worse.
If Ahmed wants to prove his “I’m not political” positioning, he should talk to his colleague John Blake – as in the APP bit of OfS, this work needs a decent theory of change and for posited interventions to be evaluated.
Who’s most positive?
Beyond the free speech question, there’s no end of fun to be had with the data. DK knocked up a quick dashboard to help:
If, for example, we average the positivity score across the survey to work out which characteristics are most positive about their experience, here’s the result:
- 31 and above: 84.63
- Distance learner: 82.65
- Black: 82.28
- Rest of the World: 82.12
- No disability reported: 80.27
- The student has no disability reported or an unknown disability status: 80.27
- Studying at an HE institution local to home address: 80.21
- 26 to 30: 80.15
- Other sexual orientation: 79.99
- Heterosexual: 79.83
- Female: 79.79
- European Union: 79.75
- The student has a social or communication impairment such as Asperger’s syndrome or other autistic spectrum disorder: 79.62
- Male: 79.55
- 21 to 25: 79.45
- HE qualification not held by parent(s): 79.40
- United Kingdom: 79.38
- White: 79.33
- Studying at an HE institution not local to home address: 79.28
- Under 21: 78.92
- Asian: 78.82
- The student has a sensory, medical or physical issue, including dyslexia: 78.78
- HE qualification held by parent(s): 78.70
- Other: 78.55
- Lesbian, gay or bisexual: 77.58
- The student has multiple or other impairments: 77.50
- Mixed: 77.43
- Disability reported: 77.20
- The student has cognitive or learning difficulties such as dyslexia, dyspraxia or AD(H)D: 76.83
- Other sex: 76.45
- The student has a mental health condition: 76.28
If we then look at each of those in their correct category, the results are fascinating:
Age
- 31 and above: 84.63
- 26 to 30: 80.15
- 21 to 25: 79.45
- Under 21: 78.92
Disability Type
- No disability reported or an unknown disability status: 80.27
- Social or communication impairment (such as Asperger’s syndrome or other autistic spectrum disorder): 79.62
- Sensory, medical or physical issue, including dyslexia: 78.78
- Multiple or other impairments: 77.50
- Cognitive or learning difficulties (such as dyslexia, dyspraxia or AD(H)D): 76.83
- Mental health condition: 76.28
Domicile
- Rest of the World: 82.12
- European Union: 79.75
- United Kingdom: 79.38
Ethnicity
- Black: 82.28
- White: 79.33
- Asian: 78.82
- Other: 78.55
- Mixed: 77.43
Local Students
- Distance learner: 82.65
- Studying at an HE institution local to home address: 80.21
- Studying at an HE institution not local to home address: 79.28
Parental Higher Education
- HE qualification not held by parent(s): 79.40
- HE qualification held by parent(s): 78.70
Sex
- Female: 79.79
- Male: 79.55
- Other sex: 76.45
Sexual Orientation
- Other sexual orientation: 79.99
- Heterosexual: 79.83
The things that stick out there for me are the negligible differences on sex, sexual orientation and local, but the quite significant differences by age (maybe people should go into HE later in life), disability (where it really does feel like the sector has some way to go) and ethnicity.
Where should we worry?
The above are mean averages across questions – and it’s worth noting that not all questions are the same. If we look at that question that asks students how well mental wellbeing services are being communicated, for example, there are fascinating differences that suggest the sector ought to worry:
Age
- 31 and above: 81.0
- 21 to 25: 75.7
- 26 to 30: 75.4
- Under 21: 74.5
Disability Type
- No disability reported or an unknown disability status: 76.3
- Sensory, medical or physical issue, including dyslexia: 74.4
- Social or communication impairment such as Asperger’s syndrome or other autistic spectrum disorder: 73.4
- Multiple or other impairments: 71.8
- Cognitive or learning difficulties such as dyslexia, dyspraxia or AD(H)D: 71.2
- Mental health condition: 71.0
Domicile
- Rest of the World: 83.1
- European Union: 79.3
- United Kingdom: 74.2
Ethnicity
- Black: 78.0
- Other: 77.8
- Asian: 77.4
- White: 73.4
- Mixed: 71.1
Sex
- Male: 78.2
- Female: 73.8
- Other sex: 63.8
Sexual Orientation
- Heterosexual: 76.4
- Other sexual orientation: 74.3
- Lesbian, gay or bisexual: 69.4
Other interesting insights are available. If we look at who’s most positive about having their feedback acted on, the domicile split is remarkable – although may tell us more about the subjects international students study than anything else:
- European Union: 63.6
- Rest of the World: 72.1
- United Kingdom: 59.3
On organisation and management, there’s something very interesting going on with Disability that highlights the impact of getting things wrong:
How well organised is your course?
- The student has a mental health condition: 66.5
- The student has a sensory, medical or physical issue: 70.2
- The student has a social or communication impairment: 71.2
- The student has cognitive or learning difficulties: 66.6
- The student has multiple or other impairments: 69.3
- The student has no disability reported or an unknown disability status: 73.7
How well were any changes to teaching on your course communicated?
- The student has a mental health condition: 68.2
- The student has a sensory, medical or physical issue: 71.5
- The student has a social or communication impairment: 72.1
- The student has cognitive or learning difficulties: 68.7
- The student has multiple or other impairments: 69.6
- The student has no disability reported or an unknown disability status: 75.8
Organisation and management in general also has some quite significant differences by age:
- Under 21: 73.6
- 21 to 25: 70.3
- 26 to 30: 70.3
- 31 and above: 78.4
On all of the above, of course, what’s missing is why students feel the way they do. On the international student positivity question, for example, I’ve never been to a focus group that does anything other than suggest that international undergraduates are just more positive in general – but have plenty of moans and groans about their experience. It feels – both in the NSS and more generally – that the expectation level is different, which then clouds the score based on a programme’s domicidal make up.
On the other hand, whenever I’ve been to a focus group on Disabled students, the differences feel less like question or expectation interpretation and more like proper differentials in the experience – and are often about the cumulative impact of lots of little failures to reasonably adjust.
OfS is sitting on donkey’s years worth of potential explanations in the form of free text comments, that it once promised to do some analysis of but never did. That’s a pity – and one of the reasons why we’re peppering our pulse-style Belong work with Cibyl with qualitative questions to help avoid making the wrong adjustments in pursuit of better scores.
In an ideal world, both the headline results by question and these sorts of cuts might cause OfS to at least pretend that its priorities were being led in part by students. That improving students’ experience by characteristic is not an explicit concern of OfS’ access and participation function (which tends only to look at outcomes) is an issue we’ll return to on the site soon.


It’s a shame that there’s no proxy for political beliefs in the survey to help test whether holding right-wing beliefs is correlated with feeling unable to express your ideas (hypothesis: not true overall but quite possibly true once you control for other demographics i.e. those holding right-wing views are more likely to come from demographics who are more confident in expressing their views).
Having been a school governor in a lowest quintile area I can understand some of the dissatisfaction expressed by some students who’ve never had a voice before going to University, and starting from such a situation they’re always going to struggle when surrounded by more eloquent top quintile educated individuals. As for ethnic satisfaction, again no surprise when many Asian families have high expectations of/for their children, University courses are, like many school and college courses, aimed and delivered for those of middling at best ability, in many schools teachers love teaching to the lowest common denominator level as it’s easier than keeping higher ability children busy and engaged, something that University lecturers MAY also suffer from. Interestingly Black students seem to be more satisfied than all other ethnicities. Though such blanket categories are rather like shotgunning the target rather than precision rifle fire, perhaps the survey needs further refinement, or it’s delivery of results needs more accurate categories and to acknowledge differences between sub-groups and their expectations.
Disability is also a very broad church and surveys don’t pick up on the minutiae and all too often means well meaning but not understanding staff blunder along without actually improving the situation, indeed sometimes making it much worse. Being part of our Universities Disability Staff Network I interact with people with many different forms of disability, neurodivergence is a huge subject by itself as are the response differences when interacting with people with it.
Given the quite narrow spread of percentages in MOST cases we should perhaps look closer at the few outliers and focus on improvements that would benefit all not just the few and cause further dissatisfaction to the masses?
For me arguments about the free speech question are a microcosm of any discussion about survey data namely what is the highest level it is reasonable to expect any question to achieve? I think if we had 95+% of students positive on freedom of speech we’d be questioning if the survey was really doing its job, no survey will ever have 100% positive outcomes.
The differences highlighted above are not surprising although because they are solely based on student, rather than study, characteristics they miss the huge subject affects for example students on medical courses have much lower positivity around organisation and management than other students so a simple averaging of the type given here will shift that onto the types of students that study medicine.
What this work also shows is the importance of using performance relative to benchmark when judging universities. The OfS has promised to review the benchmarks which should pick up some of the significant effects noted in the article assuming they are not acting as subject proxies