


Back in January we got the traditional end of cycle data release from UCAS – giving us the first look at just how providers fared in the 2023 recruitment cycle.
Though there were a lot of insights to be had – and you can dive back in there on Wonkhe – it wasn’t the complete release we usually get. The equalities data was missing.
And now it is finally here.
Equalities in equalities
When you think about equalities data, your first thought may be about information like this:
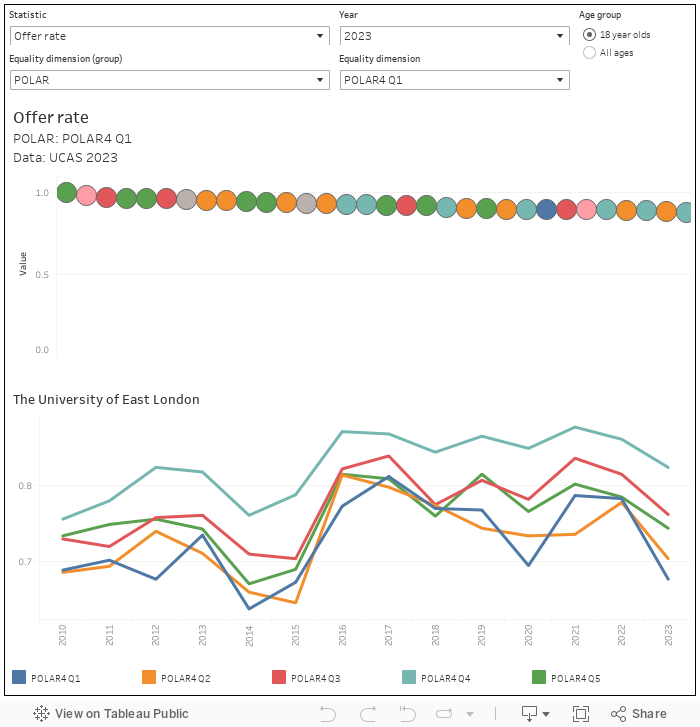
Note: to change the institution shown at the bottom, mouse over the appropriate blob on the top
Here we can see things like offer rates and placed applicants per 10,000 UK 18 year olds, across equalities dimensions including POLAR quintiles, SIMD, and ethnicities. Though it relates only to UCAS undergraduate entrants, it’s a very interesting examination of just what providers are doing to make university access more equitable and how much just remains to be done.
For instance, while the trend in thinking around access has shifted, in recent years, from the classic formulation of disadvantaged students getting to selective providers – the fact remains that just 19 per cent of POLAR4 quintile 1 applications to Oxford resulted in a place being offered. This got as high as 25 per cent during 2020, and was even at 24 per cent in 2022. This year’s drop puts Q1 back below offer rates for Q4 and Q5, though they remain above Q2 and Q3 results.
From application, to offer, to place
But the equalities data isn’t just about equalities. One of my favourite aspects is the inclusion of offer numbers alongside application numbers and number of placed students. This lets us see whether providers are maintaining applicant interest, the degree to which they are selective (applicants to offers) and the efficiency of their offer-making strategy (offers to places). Offer making is the bit of this that universities have control over, so this is the best way to examine strategic behavior in admissions.
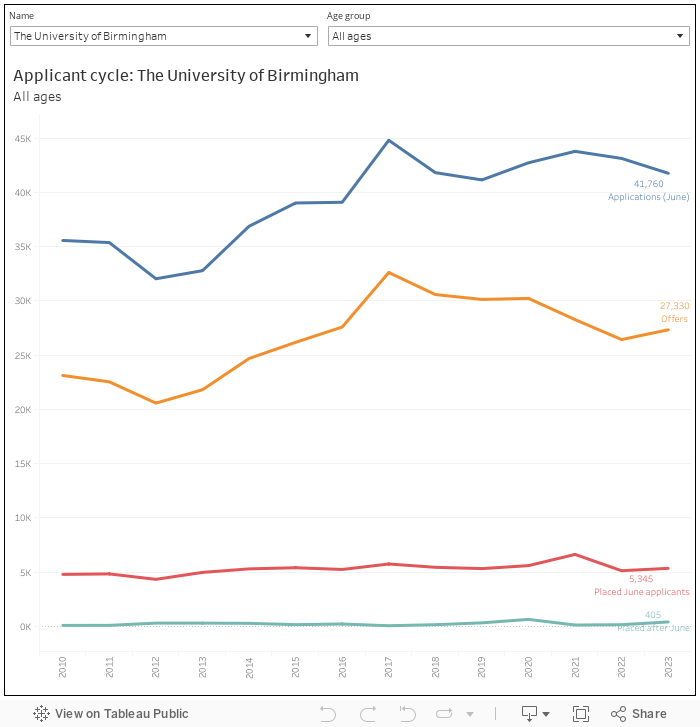
The example of Birmingham above shows a recent decoupling of offer- making from applicant numbers, and a higher number of offers not resulting in placed applicants. This is a provider that has shifted from following the market to making a strategic choice about size and shape. If you look at Buckinghamshire New University you can see a sharp rise (since 2019) in applications, offers and placements (some of these will involve franchise activity) but also the sharp drop in applications in 2018 that may have sparked this change in direction – compare a slower growth in Sunderland, or the steady state approach at Teesside.
The Russell Group splits
This is also interesting at the level of mission groups.
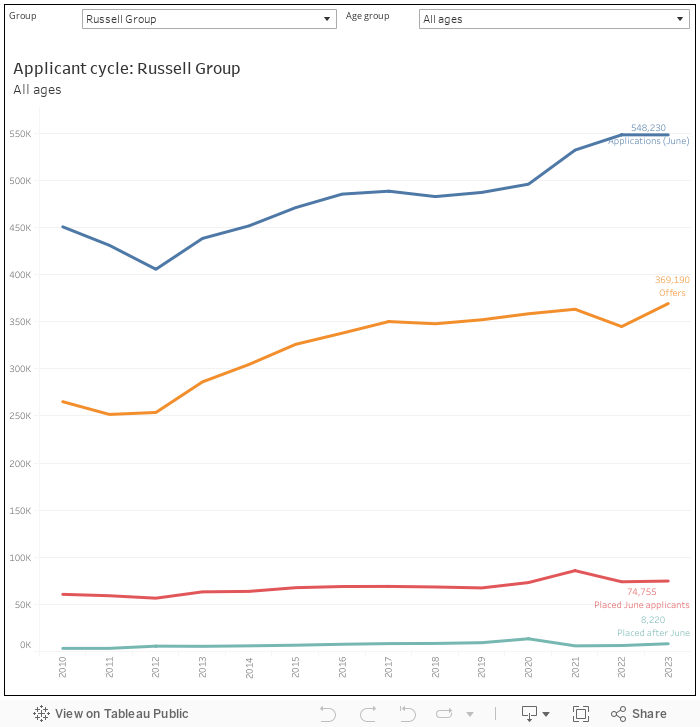
The Russell Group “big 7” (providers with around a £1bn turnover) saw application numbers fall among 18 year olds in the 2023 cycle, but managed to keep offer making and acceptances fairly stable. In the rest of the Russell Group applications continued to grow, albeit not as sharply as offermaking did – and all to keep a steady state for placed student numbers.
Also of note here is the lower (turquoise) line – this shows the number of students placed following applications after the June deadline, primarily via clearing. Yes, that is a small but significant growth among the rest of the Russell Group. Contrary to popular rumour, there is no mission group within the sector that recruits primarily from clearing, though there are a fair few that take a significant chunk of their intake via that route as the next chart shows.
Late application – but why?
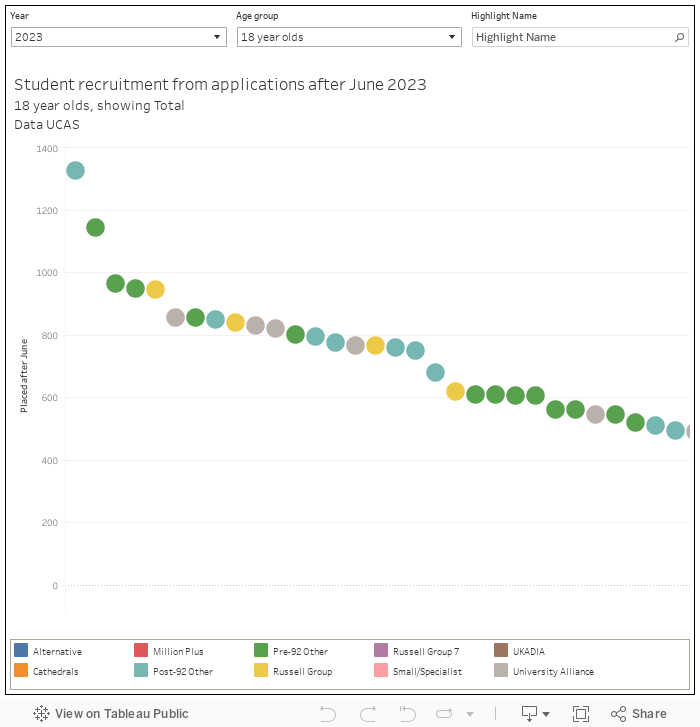
I’ve plotted numbers rather than proportions here (though proportions are available via the mouseover) and there is a strong pre-1992 showing at the top end of this chart (shout out to Leicester, where more than a third of placed 18 year olds in 2023 (1,145) came via applications made after the June deadline). With four Russell Group providers recruiting more than 600 18 year olds via this route (Cardiff, Queen Mary, Nottingham, Exeter) it is clear that the non-traditional application route is becoming mainstream.
Neither is this a widening access policy in action. For the sector as a whole POLAR4 quintle one is the quintile with the second lowest proportion of students entering via a post June application. The lowest proportion is from quintile 5, but that’s by far the highest number (12,405). But we can also see this by provider, and that’s where it gets interesting.
Some of the biggest post-June recruiters of 18 year olds are recruiting mainly from POLAR4 quintile 5 – a group that is more likely than any other to attend university. Whereas a large modern civic provider like Nottingham Trent recruits a similar proportion 18 year olds post June via clearing from each quintile, there’s a fair few older and more established providers taking more than a third of their quintile 5 students from the post-June pool.
This is interesting for a number of reasons – but for me it answers once and for all the chimaera of “middle class children” (for which read the most advantaged groups) being frozen out of selective universities by international student recruitment. If you are taking 39 per cent (Swansea!) of your quintile 5 18-year olds from post-deadline recruitment, then the middle classes do emphatically do not have a problem with accessing selective universities.