


The received wisdom that Russell Group providers are deliberately contracting undergraduate recruitment, especially among home applicants, does not hold up.
Indeed, there are a little over a thousand more English domiciled applicants who have accepted a place at a Russell Group provider this year than last. Everyone else (excluding alternative providers) has lost accepted applicants over 2022, but (as UCAS is always keen to remind us) the “last regular year” comparison to 2019 looks a bit rosier.
Naturally these top level findings hide a panoply of micro trends (the big growth subject in the Russell Group? Law).
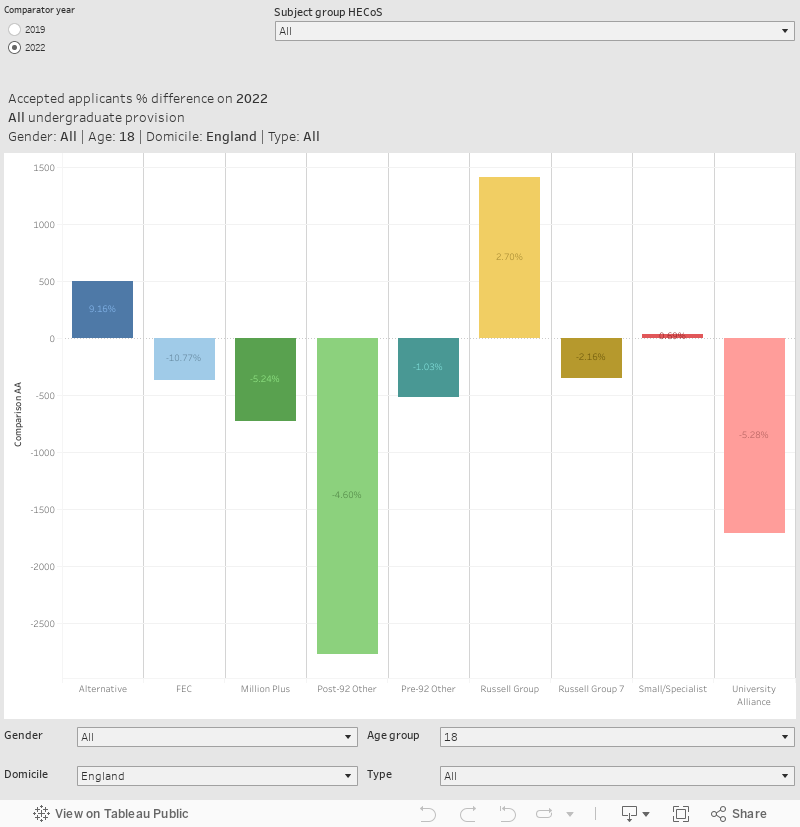
This chart allows you to look at numerical (the axis) and percentage changes (the text) in acceptances for provider groups for 2023 against either 2019 or 2022 (choose in the top left). Next to that you can choose your subject group of choice at the top CAH level. At the bottom of the chart you’ll see filters for gender, age group, domicile and application type (main scheme or otherwise).
You’ll have spotted I’ve separated out the big seven (Oxford, Cambridge, UCL, Imperial, Kings, Manchester, Edinburgh) from the remainder of the Russell Group – these mega-providers (with a turnover approaching £1bn each) feel best treated as a separate classification, but if I talk about the “Russell Group” in the text I will generally add these together.
For all subjects, you will note that the “big 7” are down on last year, while the rest of the group are up, suggesting one example of a strategic difference.
Provider level changes
Drilling down to provider level provides another layer of interest. The big winner over last year is Oxford Brookes, with nearly 5,000 extra placed students – mostly English domiciled mature students applying outside the main UCAS scheme to business and healthcare subjects. At the other end of the spectrum we find last year’s surprise growth at Canterbury Christ Church University may have been a one off.
What’s going on here? Well it is difficult to know for certain, but sudden large growth in numbers outside of the main scheme usually means a new franchise partnership arrangement (and conversely a large loss means an arrangement has come to an end).
The University of Exeter has also done very well, adding an extra 1,700 students over last year split across business, law, and the social sciences and driving a large part of the growth we see in the Russell Group. These are primarily home domiciled 18 year olds – suggesting a strategic decision to grow sharply.
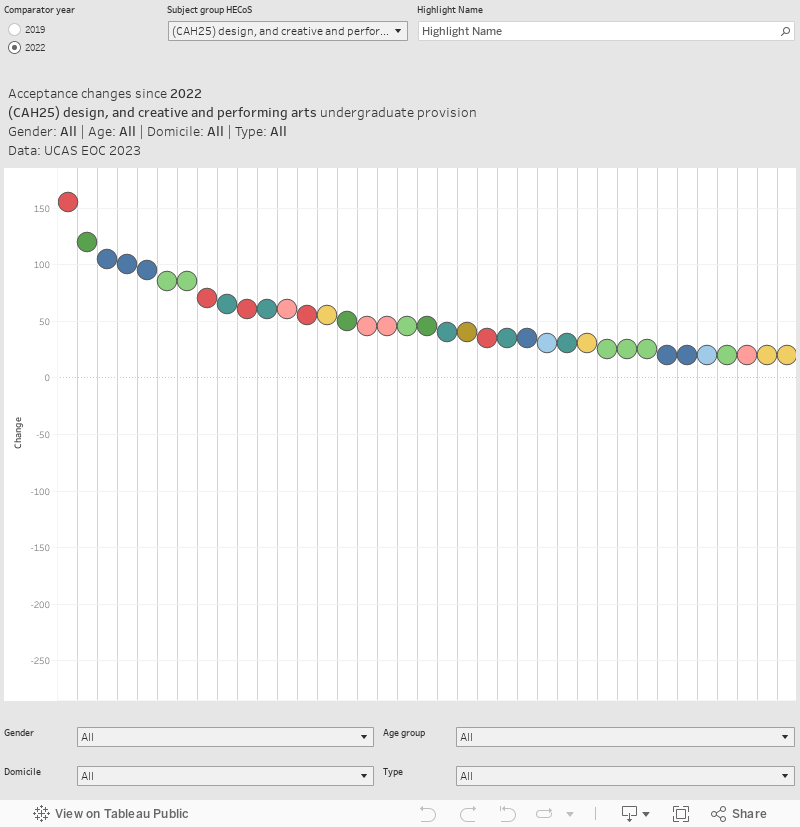
This chart shows every provider ranked by the size of the placed applicant gain (or loss) between 2023 and your chosen comparator (top left). Choose a subject area of interest and then use the highlighter to find your provider of interest – scroll left and right on the main chart. The filters work in the same way as above.
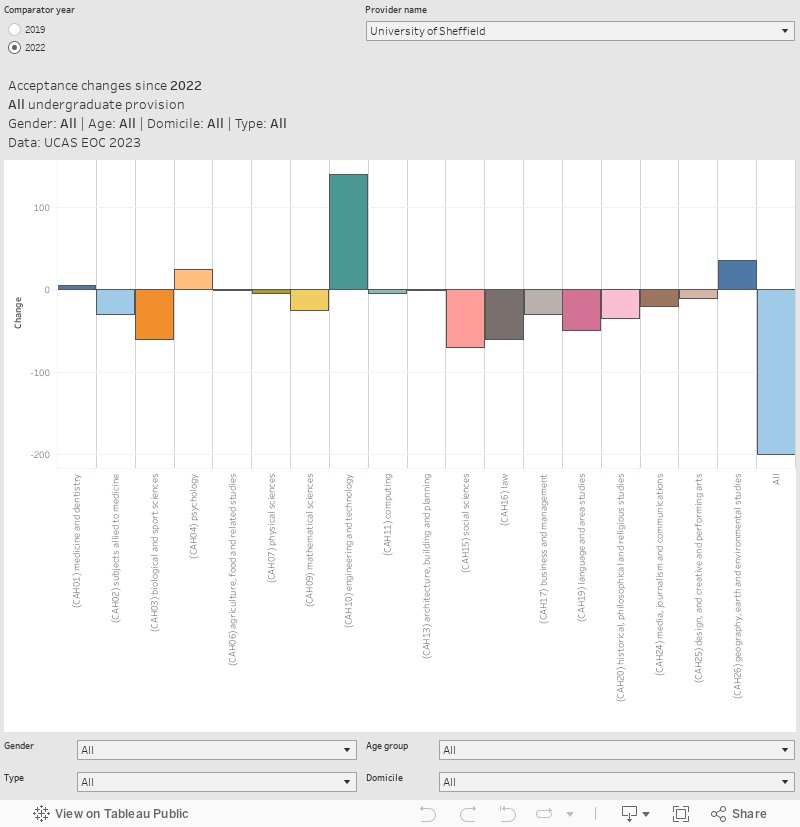
And here’s the same chart, allowing you to look at subject changes within a single provider.
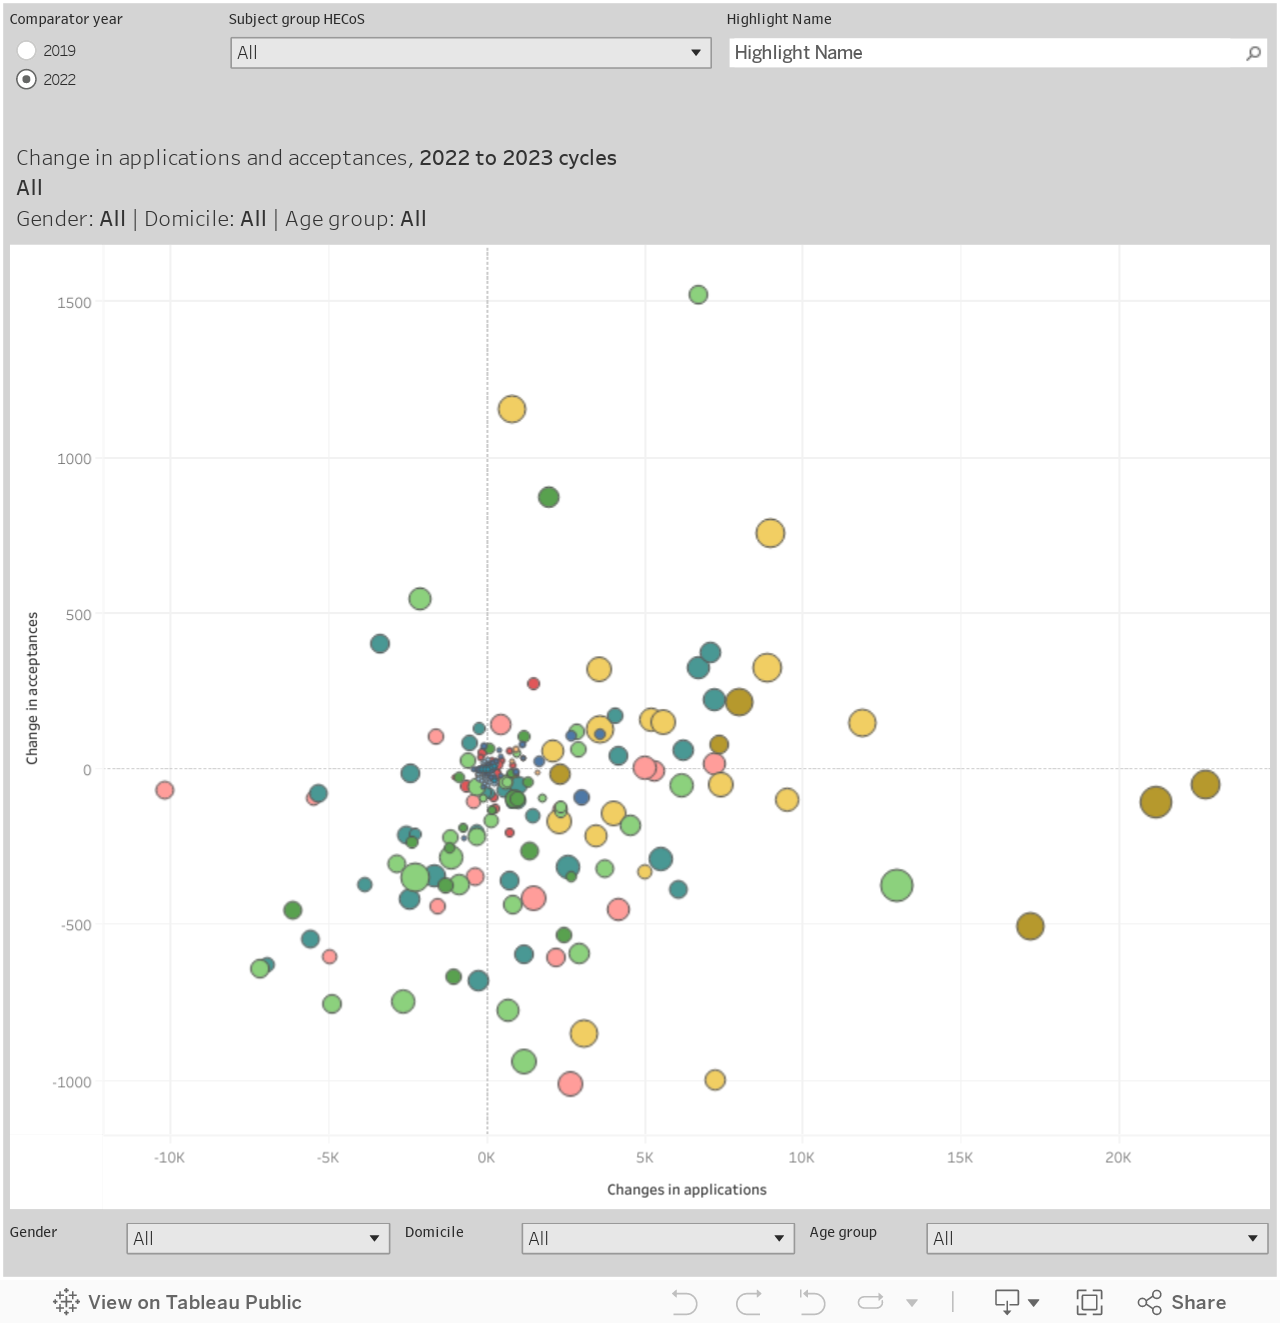
For yet another look at the same dataset, this scatter chart separates the sector into four quadrants:
- growing applications and acceptances in the top right
- growing applications, declining acceptances in the bottom right
- declining applications, growing acceptances in the top left
- declining applications and acceptances in the bottom left
I’ve done stuff like this before, but new for this cycle you can filter by subject, domicile, gender, and age. So if you want to figure out who leads the sector in admitting and attracting 18 year old English domiciled students to engineering courses you can (it’s the University of Sheffield)
How students get in
New, I think, for this year is the ability to look at what qualifications these new (UK domiciled) students held on entry. The big caveat here is that mature students and non-traditional students tend to have very different qualification profiles, so any provider that recruits large numbers of mature students will show a large number of “other” qualifications.
We can slightly get around this by filtering to 18 year old students – allowing us only to look at non traditional entrants. One established provider beginning to diversify entry routes in this way is the University of Leicester – around 300 18 year old UK applicants entered with “other qualifications” this year – the highest number and proportion on record for Leicester.
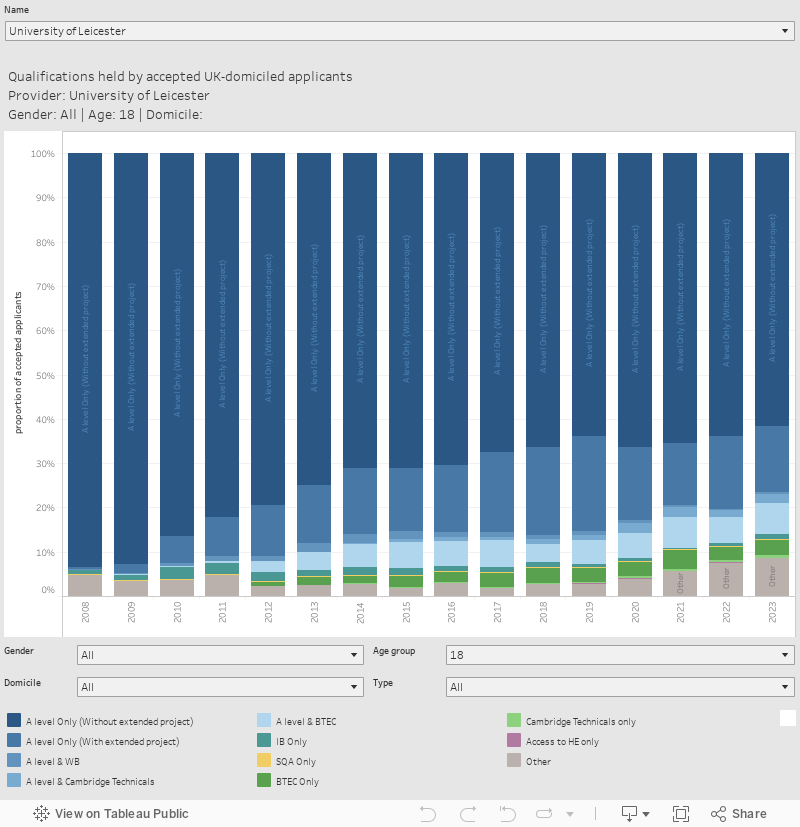
However, the big modern civic providers (Manchester Metropolitan, Nottingham Trent, Sheffield Hallam, Liverpool John Moores) are very much the players doing the heavy lifting among these groups of applicants. University is no longer just the thing that you do after you get your A levels, and if providers are finding candidates that can benefit from a university education outside of the traditional pools, this feels exactly like what should be happening.

Proportional trends
There’s fashions in data analysis – so allow me to introduce you to one trend that has captivated certain parts of the sector recently.
Any number of expensive consultants will happily sell you a look at the proportional growth (or shrinkage) of your recruitment in a given subject area, and balance that against the growth (or shrinkage) of that subject area as a whole.
Take the creative arts, for example. Overall, the undergraduate market (in terms of applications) is shrinking – year on year it is down 4.7 per cent.
Within that, provision at the University of Bristol has grown by 29 per cent. Bristol used to have 0.36 per cent of the sectors intake of English literature undergraduates back in 2019 – by 2023 this has risen to 0.57 per cent.
What’s interesting here is that this is against shrinking application numbers in the subject – both at Bristol and overall.
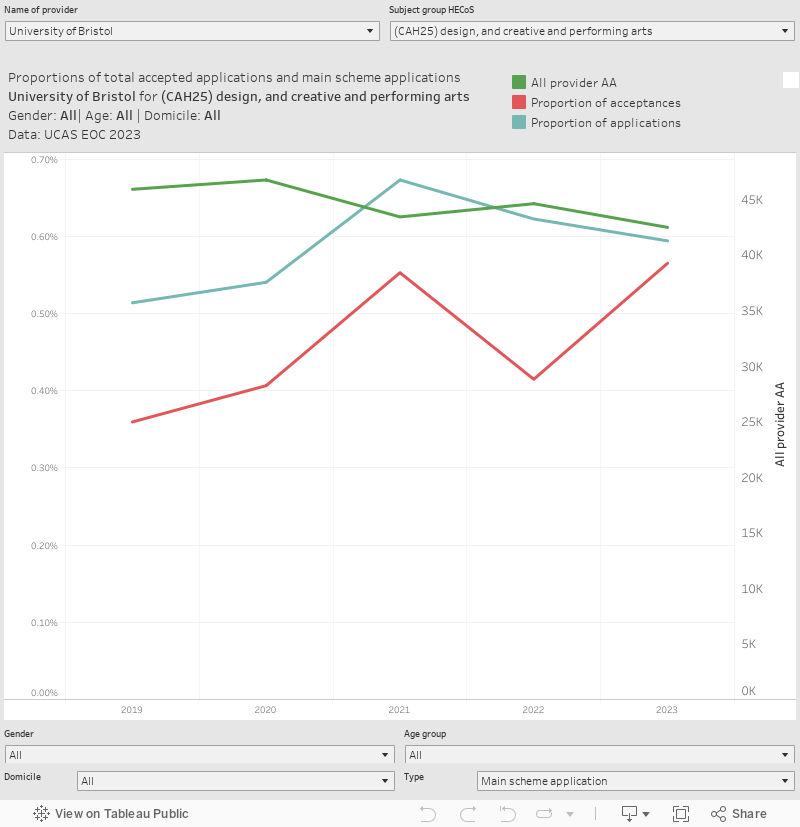
This is a complicated chart to interpret, but it is worth persevering with! Choose a provider and subject area at the top (and refine with the usual filters at the bottom – though I’d leave “type” on main scheme to make the applications proportions work). The red line shows the proportion of all acceptances in that subject area that happen at your chosen provider, the light blue line shows the proportion of all main scheme applications in that subject area that were to your chosen provider). Just for ease of reference, I’ve added the number of applications to that subject for all providers year on year (navy blue line, right hand scale)
The generally accepted interpretation here is that you don’t want to be a growing provider in a shrinking market – creative arts is clearly declining in popularity, and however impressive the academic (and marketing) effort behind the relevant department at Bristol it is going to find it harder to grow recruitment further in a declining market.
Of course, no wise senior manager would make a decision to close a course or department on that basis. The affordability and complementarity of provision – how much money you make (or lose) per student, and to what extent resources (staff, estates, equipment, materials) can be spread across numerous courses also have a role to play.
But fundamentally, creative arts at Bristol (and many similarly excellent departments that are not flattered on these metrics) are an important part of the overall idea of the university in question. Some things, you want to hang on to.
What’s happened to the equalities data?
Usually alongside the provider level end of cycle release we see a load of data about equalities – offer rates and the like. I’m told this will arrive at some point next month.
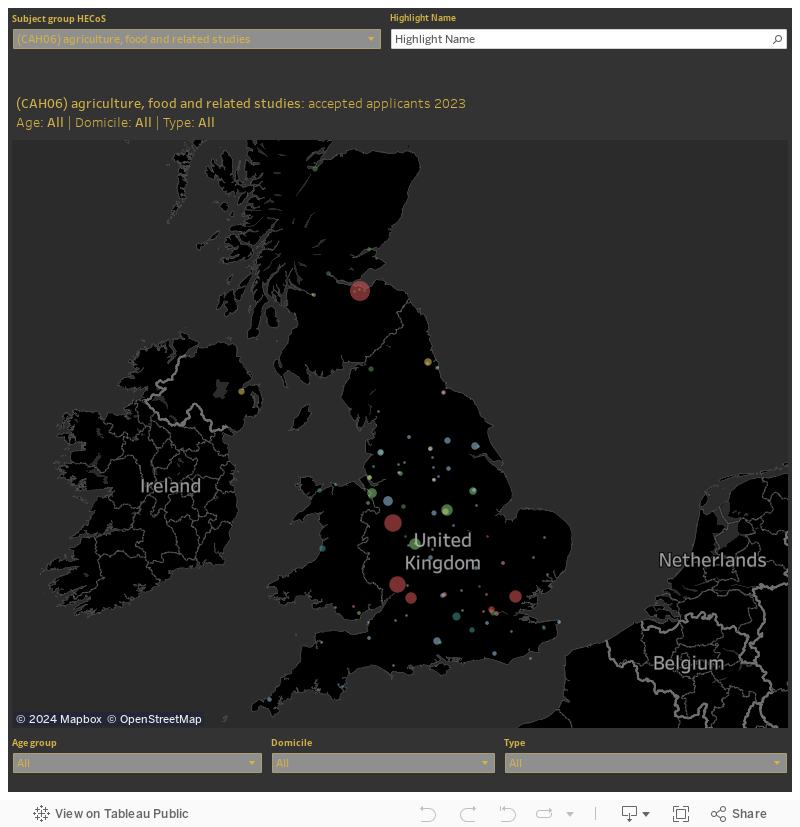
Meanwhile, here’s a map of recruitment by subject. I know some people like maps.
Given the other story on the site today about franchised provision, do these numbers inlcude franchised provision? I note some comments about large increases in mature students in business and healthcare subjects outside of the UCAS system which would seem to correlate with the profile of students at these possibly fraudulent providers.
UCAS data relates to registered students, so as I note in the article very large increases in non-traditional recruitment could usually be assumed to related to franchise and partnership arrangements.
As you (and NAO) note, not all of these arrangements are fraudulent or even questionable.
David, thank you for the excellent work in this article and the resource available. While I take your general point about the challenges for some subject areas, illustrated through proportional trends, it is possible to succeed in a declining market. A different mindset from the current expectation of endless organic growth will be required but a more nuanced approach would be no bad thing.