


The Office for Students has published a lot of data recently. But the expected Start to Success (STS) release, slated originally for the “end of November” has yet to appear.
It’s been a tough year for the English regulator, so in the spirit of Christmas I’ve decided to release my own version, today, at course level. The majority of courses sit neatly in the top-third of my ten point scale – but there is a small but significant number that struggle.
Almost exactly a month ago I presented an experimental version of this experimental metric, which combines the projected outcomes (Table T5) of the non-continuation UK performance indicator, and data from Graduate Outcomes on “highly skilled” graduate employment. At the time, I noted:
In some ways, these metrics are both measures of probabilities – the likelihood that any given entrant will graduate, and the likelihood any given graduate will get a highly skilled job”
Those metrics in full
Though choice of provider will have an impact here (as, indeed will prior attainment, subject of study, socio-economic background, sex, and region of residence) I was really expecting this to end up as an attempt to square the “low quality” course circle. There is a lot of course level – and compound course level, as I’ll get to – data in the HESA Unistats collection, and as it happened this year’s version dropped earlier this month. So this is what I ended up with:
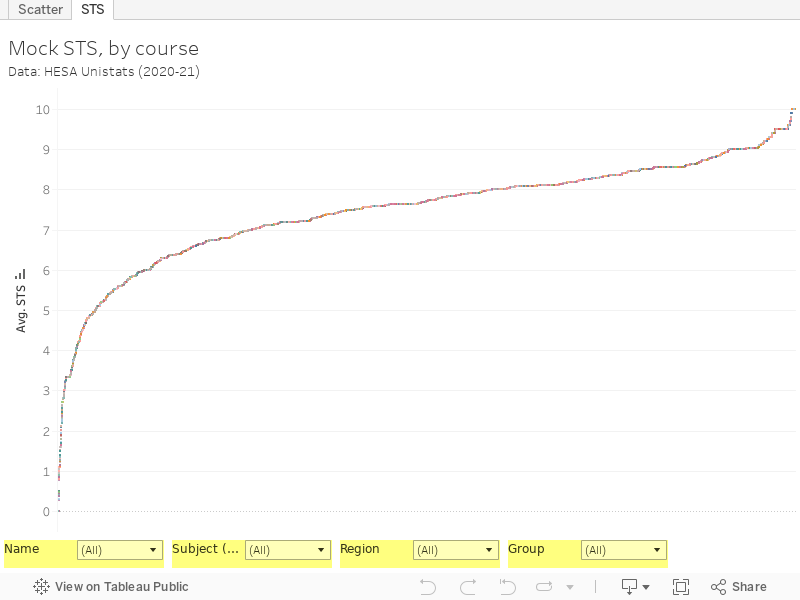
Each tiny, tiny, dot is a course of study at a UK provider. You can filter by provider (“Name”), subject (full CaH), region, or mission group using the filters below. To remind you, I’m constructing STS thus:
“I’ve multiplied the percentage projected continuation to a degree award with the percentage of students in employment that reported being in a highly skilled (SOC 1-3) role in the latest Graduate Outcomes data. As the generated scores generated are unwieldy (the top score is 10,000), I have then divided by 1,000 to give a handy 10 point scale.”
The multiplicative nature of the metric means a high graduate outcome score would be offset by a low non-continuation score. To score well, a course would need to keep most of the students it enrols, and see them all in high-skilled roles after graduation. It hardly needs adding that courses that recruit from disadvantaged populations (more likely to leave their course for non-academic reasons) or that lead to “non-skilled” roles (based on the largely arbitrary designations of jobs) lose out.
Remember, this isn’t merely a product of my depraved imagination, it is very close to something that OfS is cooking up as we speak. And this fits very neatly with a manifesto-inspired DfE idea to somehow remove the “worst” courses in English higher education.
The trouble with course data
Unistats is the source of all of the public data we have on the actual courses that students study on. Even the UCAS database is kept behind locked doors, and HESA never otherwise gets beyond a fairly broad subject level. Because courses are less permanent than providers or subject areas, and exist at widely differing sizes for wildly differing reasons.
Data on courses, therefore, is unreliable in nature. The scatter graph that details the impact of the two variables on my mock STS is helpful in understanding this.
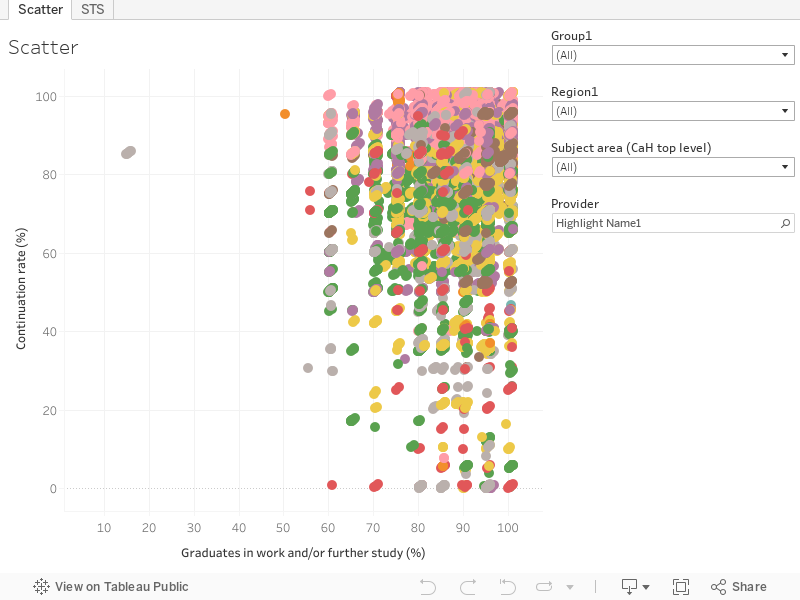
Just look at one of the tool tips. The first thing you spot may be that in some cases, the two variables come from two different subject areas. This is a peril of rounding together data – sometimes a course may be included in different aggregations that make sense at provider level but look weird when examined together. So a course in “Law and Accountancy” may have non-continuation based on all law students at a provider, and employment data based on all business students. Some courses, of course, include data for both subject areas. I’ve averaged these for the main chart.
Any course level metric will see this effect. A law and accountancy course so could arguably fit equally well in either place – and either attribute may follow the norm for one or other subject or both. This also needs to be borne in mind when you look at subject level data – some courses, and thus some students, will fit equally well in either.
You’ll see that some courses themselves are quite small, and with responses to Graduate Outcomes being likely to be even smaller this is a big reason for us to use aggregated data in the first place. But combining lots of courses together means that the actual pockets of poor outcomes (which is what we were looking for in the first place, remember?) are disguised. The idea of a “subject” in a provider is an elastic one – and the scope for deliberately returning different student groups to different subjects to maximise aggregate outcomes is clear.
So what now?
STS was, I think, supposed to be a decisive move by OfS in generating a defensible measure of what a “low quality” course may be (after my efforts previously proved fruitless). There are certainly some courses that perform less well than might be expected on this metric, but this needs to be a starting point for gathering more detailed data to understand why. The idea that providers are deliberately running low quality courses for financial gain is obviously troubling in the abstract, but every provider (as required by the QAA Quality Code) has a robust method for maintaining academic standards that could maybe be inspected as a first step?
Is the MPharm Pharmacy degree at King’s College, London really the worst Pharmacy degree in the UK? In all honesty, probably not. Is Queen Mary the worst place to do Physics? I doubt it. But if we base everything on what we see through the STS lens, this is what we are left to believe.
Really, the courses ministers want to get rid of are the ones that make them cross. There’s no metric that is going to be able to find them – if you want to arbitrarily carve up the higher education sector you can’t use “following the science” as a justification.


Great stuff as always David. Amusing that when I filter down to my provider, which offers a large number of “courses”, two almost identical course variants from the same department appear at the top and (almost) bottom of the scale.
Let me rephrase that. Upon closer inspection I see that the *both* of the “top” two “courses” are slight variants of the “second-from-bottom” two “courses”. Even better!
Beautiful isn’t it? Any course or subject level dataset will be riven with artefacts like this – I’ve presented them here rather than smoothed them out.
David,
Invigorating as ever.
Two thoughts:
1 Whatever happened to “disaggregate, disaggregate, disaggregate”?
2 Also, maybe the graduates have a legitimate view of course quality? “Did the course help me do what I wanted to do, achieve what I wanted to achieve, become who I wanted to become”? Or does the government know what’s best for me?