


“I’ve never seen this before. Look! Discontinuities in the transition matrix!”
“What is it, Doctor?”
Nicola looked across the console at her time-travelling companion, resplendent as always in one of his garish ties. Glasses askew, he peered into the spinning visualisation of the OfS Data Cube.
“So they come in here” – he pointed at one end of an incomprehensible map – “and they don’t come out here” – he pointed at the other end. “Somewhere in the middle, they just… disappear.”
“Who disappears?”
“The students, Nicola. They go in, but they don’t come out.”
“Like Willy Wonka’s chocolate factory?”
The Doctor grimaced. “No, Nicola. I met Willy Wonka back when I was travelling with Susan. He’s Approved (Fee Cap) now. But that’s beside the point. We know when students enter university, and we know how many of them there are that stay on, but the same number don’t emerge at the other end with degrees.”
His companion was unimpressed. “But is that really important right now? I mean the whole system is struggling with this deadly virus… surely the students are in there somewhere? I mean, they’re not in a sink state, or anything like that. They’re probably just resitting exams. Won’t they just – you know – pop out a bit later?”
“Pop out a bit later? We already controlled for intercalation. Refinements have been introduced to ensure a consistent approach to the treatment of intercalating students when intercalation occurs within the same provider or involves a different provider, which has a positive impact on the outcomes reported for the medicine and dentistry subject area for providers with this provision. While this refinement results in projections that are more representative of these students’ outcomes, in looking at the underlying student data we have observed anomalies in data reporting practices related to intercalation periods, which may mean that medicine and dentistry rates remain understated. It’s not just some wibbly-wobbly, timey-wimey…”
“Doctor, concentrate”. His companion looked stern. “We’re meant to be coming up with a new quality measure to help us understand where these ‘low quality courses’ might be hiding out. You remember, the Man by the Fireplace?”
Petulantly, the Doctor pushed the screen aside. “Of course I remember the Man by the Fireplace. We’ve been all over the data, and although we know those courses are out there, we can’t see them. We’re not allowed to use the NSS any more, DLHE is finished and we don’t yet know how good Graduate Outcomes will be. The only thing we really have is non-continuation, and that’s not as reliable as people think.”
“I thought that if we multiplied the new Graduate Outcomes data by non-continuation we’d at least have something. I mean the “highly skilled” measure is largely arbitrary even in the 2020 SOCs – and non-continuation only works after the first 50 days or so, but if we combined the two…”
“It hasn’t worked, has it, Doctor?” Nicola folded her arms.
“No. We can’t even call it “Start to Success” any more. That Kernohan plotted it with Unistats data of all things, based on a letter he wasn’t meant to have… and although that data is even more dicey, it demonstrated how arbitrary the whole thing is. He’s done that with all the good data – LEO, NSS, POLAR…”
Nicola smiled archly. “I was wondering – is he a future version of you?”
“No. That’s Mark Corver. But anyway, this is all I got.”
He pulled the screen back round.
“What is that Doctor? It looks like you’ve hammered it together in a lockup on an industrial estate in Sheffield!”
He ignored his companion.
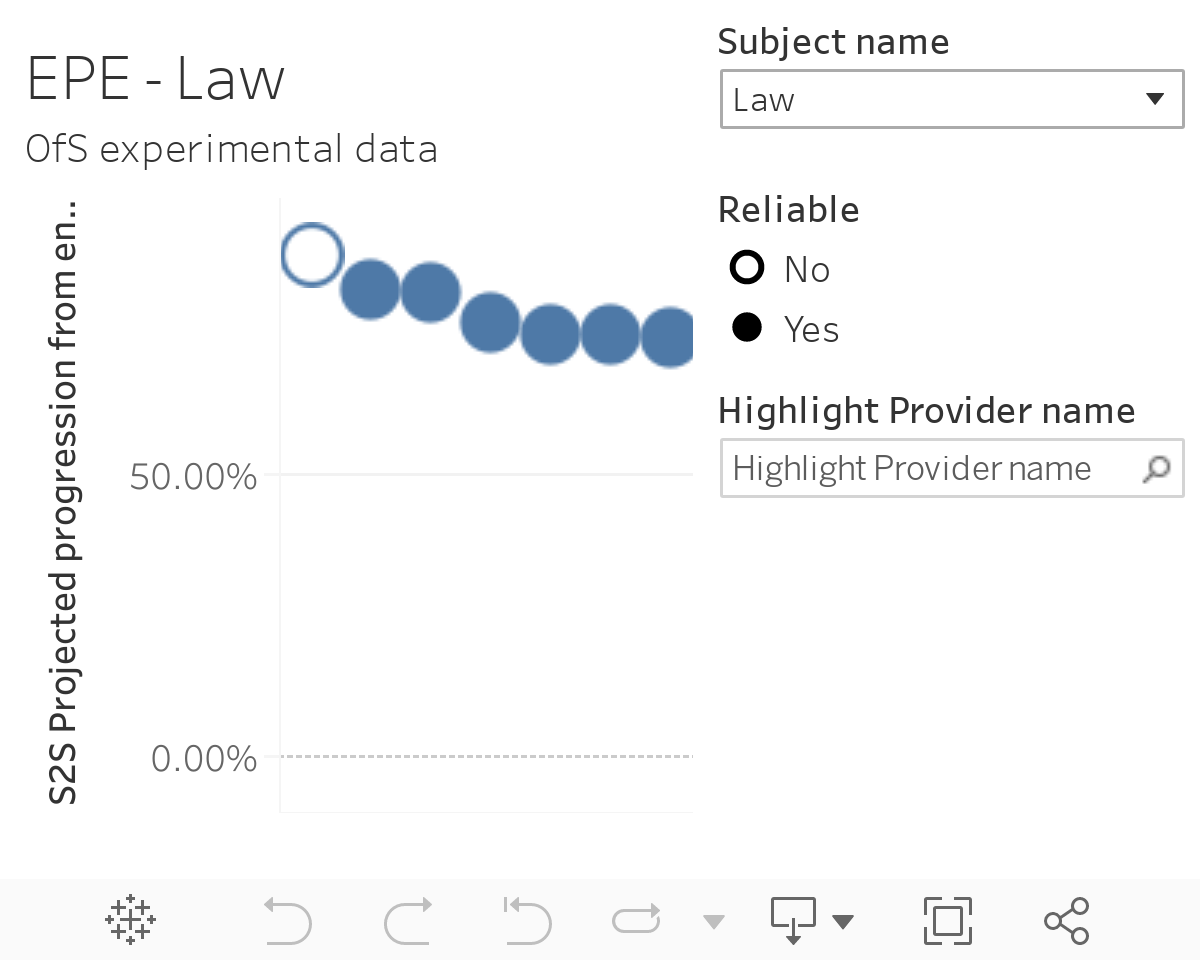
“I call it ‘Entry to Professional Employment” – EPE…”
“Like the sword used in fencing…”
“Yeah, swords are cool now. I’ve plotted for each provider by top level subject, based on the percentage of graduates in highly skilled occupations or any further study from Graduate Outcomes, and the projected continuation to degree qualification based on table T4 of the HESA KPI…”
“That’s two completely different cohorts. And anyway – anyway – more to the point, you say you’ve plotted it by provider but who is Provider 39? These are just numbers.”
“It’s all just numbers. I had an informal consultation with the providers, and they thought it was rubbish. So I couldn’t use their names. But it does show us that some courses do better in keeping students and finding them jobs. There’s huge difference by subject”
“Wouldn’t that be based on the region of graduate residence, sex, ethnicity, prior attainment, and socio-economic background? Like Liz Truss said?”
Shuddering at the mention of that name, the Doctor stood up. “But the two component measures -they correlate!”
“Doctor, R squared is 0.32. That’s not a strong correlation. That’s barely a correlation. Don’t you listen to the Wonkhe Podcast?”
“I know, I know.” The Doctor sat on the floor of the control room, defeated. “But how do we win this – how do we find the poor quality courses?”
“Well, once we would have just used the power of love. And maybe a song. Then there was a time we would have made a long, powerful speech – but now Michael Barber is retiring… so…”
“… but we solved this problem once before, far back in the past. We have just the tool we need, and we just need to activate it. We’re going back in time further than we’ve ever been before. It’s time to…”
“You don’t mean…?”
“I do. Bring back Subject Review!”


I couldn’t help reading the intercalation paragraph in the voice of Sir Humphry 🙂
And the Mark Corver reference made me laugh.
But at the heart of it, it’s all a bit of a mess isn’t it. It reminds me of the maxim that ‘if you torture data long enough, it’ll tell you anything’ 🙂
Last podcast was fab BTW.