


As I said back in November 2018, anyone who spends time with students will have overheard a conversation like the one I heard recently on the bus.
“Nine grand! Where does it all go?” was the comment from someone totally unaware of the real costs of providing the higher education experience. During the USS strike, lots of students signed petitions neatly dividing up their fee by the number of taught contact hours, forgetting the costs of the library, IT, student support, and the estate. And fee transparency has been a key manifesto pledge for students’ union officers for years – but few have ever managed to chalk it up as a “win”.
The good news is that hot on the heels of OfS’ Value for Money “strategy”, Universities UK has finally responded with some sector leadership – producing “A guide to presenting institutional financial information to students”. The question is whether compliance with the guidance will actually solve the problem. There’s a fine line between information designed to “sell” the institution and information that’s actually useful to students and their representatives – and it looks like UUK’s guidance is below that line.
Back to the future
It’s been a long time coming. When £9k fees were invented, government envisaged value for money and information about where fees were being spent to be a key component of the system. 2010’s “Students at the Heart of the System” white paper committed to “work with HEFCE to … promote greater transparency and help inform the choices of prospective students”, and in the January 2013 grant letter, Vince Cable and David Willetts argued that “under the reformed HE system, students will legitimately want to understand what their fees pay for. This places the onus on institutions to provide clear information and to be able to demonstrate value for the fees charged”.
HEFCE responded by commissioning research that argued that providers should make the information more accessible, position it clearly on institutions’ own websites, make it clear, provide a useful level of detail, and that data should be comparable – making it possible for students to compare “financial information for different institutions and over time”. HEFCE Guidance to higher education providers followed in 2014 (airbrushed from history in this new guidance), but it took until DfE’s consultation on OfS’ regulatory framework in 2017 (in which Jo Johnson promised a “transparency revolution”) before we got a suggestion that OfS might require information allowing “students to see how their money is spent” – and even that got watered down into a mere suggested behaviour.
The issue hasn’t gone away. The HEPI/Advance HE Student Academic Experience report found that 73 per cent of students “had not been provided with enough information on how their fees are spent”, and last year Universities UK research found that students “expressed frustration that they could not see a breakdown of costs attributed to tuition fees”.
Great scott!
First then let’s compare 2014’s voluntary guidance from HEFCE with 2019’s voluntary guidance from Universities UK. Both documents argue that information needs to provide a useful but not “overly complex” level of detail. Both stress that it needs to be “accessible” to students who may not have expertise in interpreting financial information. The documents agree that information needs to be up-to-date, and both stress that it needs to be clearly signposted on institutional web-sites – with technical language clearly explained.
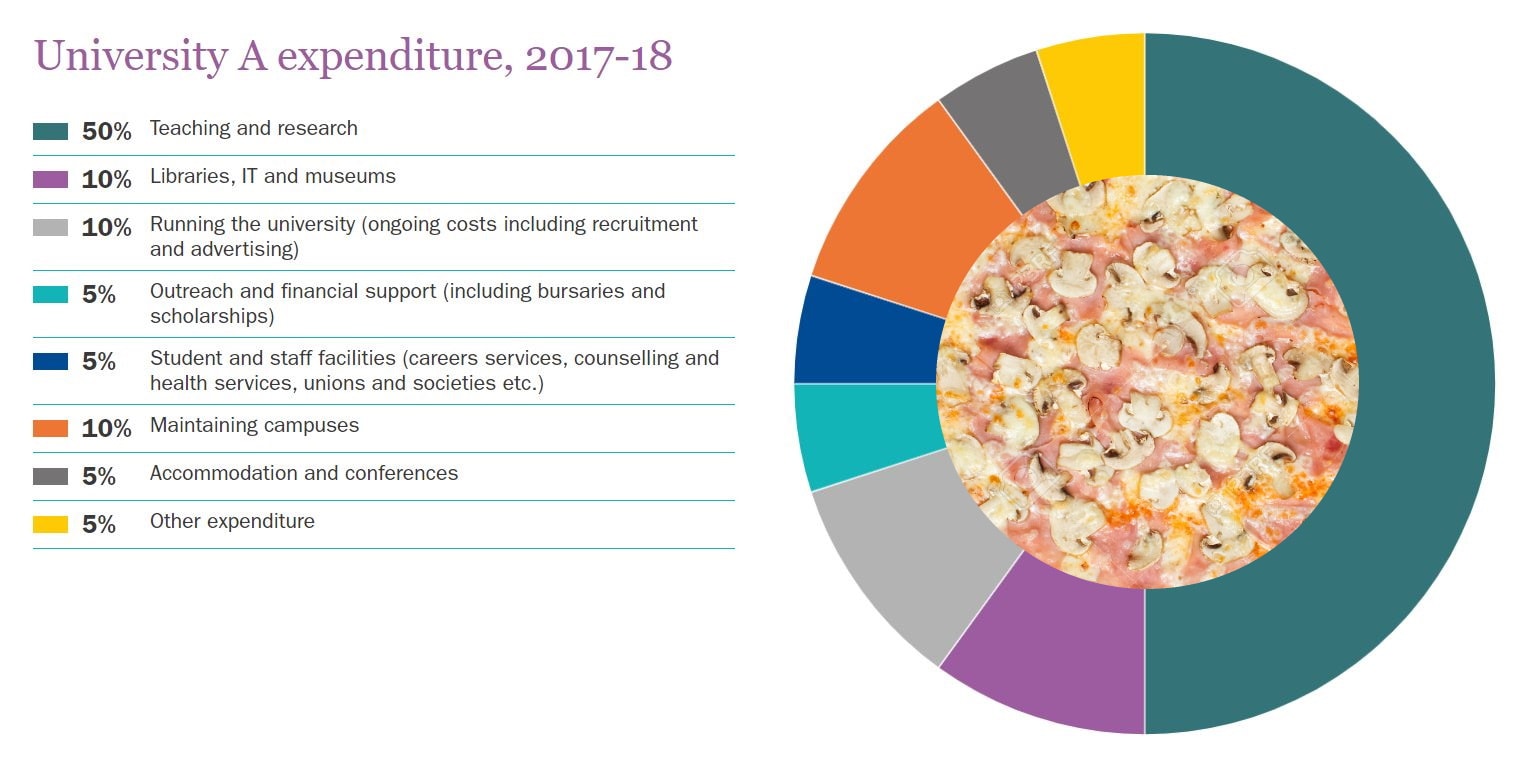
When it comes to the information itself, the idea is that everyone should do a pair of those pizza wheel things for income and expenditure. On income the 2014 iteration recommended five pizza slices – funding body grants, tuition fees and education contracts, research grants and contracts, “other income” and endowment and investment income. Then on expenditure we got seven – academic departments, academic services, administration and central services, premises, residences and catering operations, and “other expenditure”.
Hoverboards
The 2019 version is broadly the same – but suggests providers add some shiny glitter to the numbers. Income from fees is to be placed “in the wider context of other sources that together fund university activity and the student experience”, presumably so that students don’t go thinking they can just divide their fee up by the number of contact hours. “Institution-specific context” around income and expenditure should be developed, describing to the mere student how things like “the academic environment is supported by spending”. There should be a description of “non-teaching spending” that shows off the “benefits and added value” for students. And narrative should “highlight unique opportunities for students that may not be reflected in spending data”, like study abroad opportunities or work placements.
If that starts to feel like it’s on the salesy end of the spectrum, you’d be right. UUK advises highlighting the institution’s charitable status, explaining that any surpluses “are reinvested to enhance the student experience” (if there are any). “Simple explanations” of how the student funding system works should go in. And when it comes to investment in new buildings or facilities, the narrative “could explain past investments and how they are benefitting current students”. There’s even a suggestion that universities “explain [financial and political] risks currently facing the sector”.
Then when it comes to communicating all this to students, it should appear on “student facing mobile applications”, “campus poster boards” and “social media groups”. Naturally, the first university finance director to do a Tik Tok clip set to Simply Red’s “Money’s too tight to mention” will receive a Wonkhe mug.
Flux capacitor
As a special treat, we’ve Tableau’d up a version of the UUK example for every provider that HESA has data for- so you don’t have to. Use the drop down menu to choose your provider.
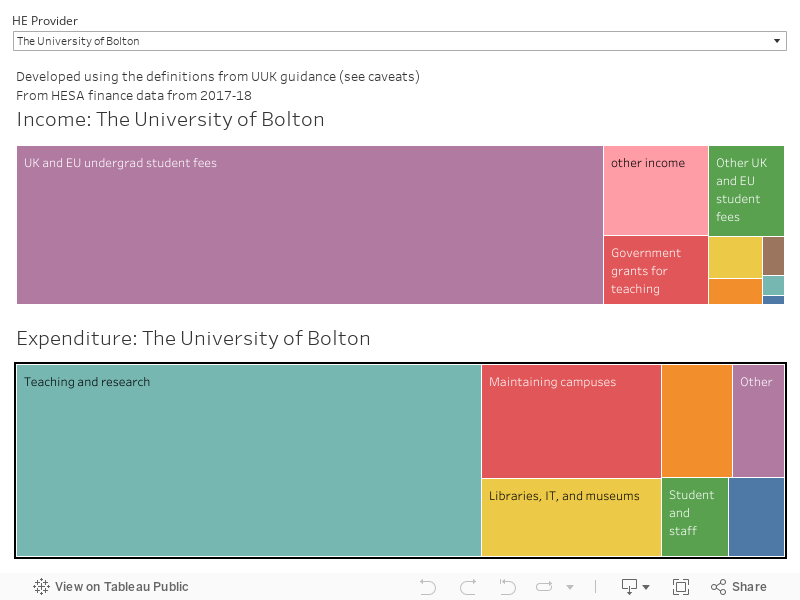
We’ve used an area plot rather than pizza pie charts/pizza wheels, they’re just plain easier to read (though for those who like pie there’s some on the other tabs). And we’ve included actual amounts (rather than percentages) in the tooltips, because we think students deserve usable data. As far as possible this represents the guidance in the UUK document (pages 13-17) using the stipulated field(s) from the HESA Finance Record of 2017-18.
One key issue is that we don’t have access to institutional data resources on provider specific bursaries and outreach spending. Yes, this isn’t all reconstructed from publicly available data – never mind what it says on page 13. We’ve omitted these items, both from the totals and from the “financial support to students and outreach” field – which now just contains national bursary scheme spending.
Will it work?
It’s a start, but there are big problems here. UUK’s suggested format fails to “net off” areas of interest to students that have income and expenditure lines. Saying that you spend “£x” on student residences or catering, for example, without netting off the income isn’t far off putting £350m for the NHS on the side of a Brexit bus.
“Transparent approach to costing” data manages to differentiate between research and teaching, and that HEFCE research demonstrates that students want to know the difference rather than have it lumped into “academic departments”. If providers are proud of delivering research-led teaching, then making that data available could emphasise the perceived link.
Students want to know about cross-subsidies. “Some subjects cost more to deliver than the fees that UK and EU students pay”, says the suggested narrative. Yes, but what about those that cost less? Why would we want to hide that from students?
All the research – both the HEFCE 2013 study and the OfS 2018 piece – stresses that students and their representatives want to be able to make meaningful comparisons between courses and between institutions, none of which would be possible with this approach. They want to know about cross-subsidy and deserve to know about it too. If the accounting statement of recommended practice followed by HE institutions enables some comparability for finance directors and university governors, can’t we develop one with the categories that make sense to students, applicants and student reps?
And let’s be very clear – involving students (say from the students’ union) in financial decision making is not the same as promoting confidence amongst the student body that the money is being spent wisely. There’s little on the former in here – unsurprising given that guidance that stresses working with SUs has been developed by a group without… any student any reps on it. Focus groups are not the same, folks.
Confidence is a preference…
There’s no doubt that the sort of information (in the sort of format) being suggested could work to promote “confidence” among students and the wider public that tuition fee (and other) income is being put to good use.
But if we take the view that a sector of diverse, autonomous institutions should be able to make different investment decisions, transparency data should be capable of influencing student choice. And if we want to treat students and their reps as real partners – capable of understanding the tough financial decisions that providers face – we should be working towards information that enables them to both compare and influence where their money goes.
Ultimately, the question that lingers for students is “where do my tuition fees go”. Compliance with this guidance is sadly not really the answer to their question.


For universities who rely on international student revenue there seems to be little invested to know, support through employment, and leverage their international alumni. The number one reason international students choose to study abroad is to improve career outcomes yet most universities have not resources allocated to this.
Cturtle partners with universities to;
KNOW international alumni: At Cturtle we have identified over 1.3M international alumni in ASEAN, Greater China and India and track the employment outcomes of n=162,290 unique international alumni. Our data focuses on how student experience and graduate employment affects international alumni’s likelihood to recommend their university and country of education to future international students.
ENGAGE international alumni: Cturtle+ is a partnership program to support your international alumni employment outcomes across Asia connecting them with over 1,000 employers across ASEAN and Greater China, complimenting and working with your careers, alumni and international student recruitment teams.
LEVERAGE international alumni: in partnership with UniAdvisor we leverage alumni engagement for targeted marketing campaigns and student lead generation.
From a student perspective, is it not disappointing that on the expenditure side, teaching & research are lumped together? This does not really inform the student about the commitment to supporting teaching because the balance of expenditure between T & R can vary markedly between institutions.
The list of participants in the guide casts a lot of light on how the guide has come about – not a student in sight (unless they are relegated to being within ‘other stakeholders’) for something that is all about what it is students want to know. The same token nods left to the final bullet points around communication asking universities to ‘engage regularly with students’ rather than putting front and centre the idea that to find out what information students want, you might actually ask them.
The ‘netting off’ point going down to the residence and departmental levels as you mention is exactly the sort of thing that would be a new, concrete recommendation for introduction that we would want. Unfortunately, a group with the composition such as this was always destined to churn out more of the same.
I am having trouble with the income figures above as they don’t seem to match my HESA return. Ie Non EU student fee data is £20m out. Has the data been adjusted in some other way? Thanks