


There was a bit of a contentious motion at last week’s UCU higher education committee (HEC).
If you’re on twitter as much as I am it is very likely that you’ve seen a growing argument about student number controls, and whether the union should take a position one way or the other. There are various arguments on various sides of the ideological debate, but in my traditional fashion I’m going to ignore all of the arguments and talk primarily about data and subject codes.
What happened at the UCU HEC?
Here’s the three parts to motion as presented on 30 April:
HEC notes that: the combination of Covid-19 and marketisation of HE has created a ‘perfect storm’ of adverse conditions; some UK universities over-recruited in 2020, and expect to do the same in 2021, in effect “poaching” from other universities, particularly post-92 institutions.
HEC believes that: The current uncapped, “free-for-all” system of student places provides undue advantages to highly ranked institutions, and rewards gaming the system; fair competition is neither possible nor desirable, and that attempts to induce an education “marketplace” have done enormous harm to the sector, workers and students
HEC resolves to: request modelling of student number control mechanisms for UK HE to be reported to the next HEC for further action; support a robust form of student number controls aligned with UCU’s general opposition to the marketisation of HE; campaign for caps aimed at the prevention of institutional failure and departmental closure
The vote on the motion tied 17-17, and in accordance with the standing orders a tied vote means no change to the current position – UCU will not be arguing for student number controls for the moment, though there’s no telling whether or not the issue will return.
There’s a couple of popular perceptions that bear interrogation here. The first is the idea of “poaching”, the second is the connection between changes in student intake and staff experiences.
In brief: student selection
It’s long been a feature of UK higher education that applicants can go to any provider they like as long as they are able to, and the university they want to go to agrees to them attending. Historically, the focus has been largely on whether a provider accepts an application.
Prior to 2012-13, a university was limited as to the number of students it was permitted to admit in a given academic year. This was capped at the previous years enrollment, plus or minus 5 per cent, with money clawed back for under-recruitment and fines levied for over-recruitment. For strategic growth plans, providers could bid for additional student numbers (ASNs) either as part of funding for a wider strategic development project or just to address current government priorities.
Some subject areas, notably medicine, still have student number caps on a provider basis – with a central decision made on the expansion of particular medical schools. We should also note here that sometimes physical or opportunity constraints act as a break on recruitment – these could be around the availability of equipment or resources, the availability of professional placements, or a desire to limit class or cohort sizes to preserve quality.
Finally, universities have their own strategic interests – the kind of thing that means an otherwise successful history department is binned off because the vice chancellor fancies being a “STEM-based” provider because they reckon that is the way the wind is blowing. Likewise, a strategic decision to grow a subject area rapidly needs to be properly resourced in terms of staff and infrastructure.
In brief: selecting students
The other side of this equation is how students decide both to apply to and accept a place offered by a particular provider for a particular course. There’s been huge amounts of research into these decisions and how they are made – the current best guess is through conversations with friends, family, teachers, and students and staff on a particular course at a particular provider. The vast investment in applicants facing data (and in league tables) doesn’t appear to move the dial, for home undergraduate students at least.
You’ll notice I’ve not mentioned academic quality here. Though this may be a factor for some applicants (though how they measure and experience this will vary hugely), others will select based on course coverage, location, and peer recommendation. Some applicants use tariff (the ludicrously inflated A level grade expectations in the prospectus that in reality most students never get) as a sifting tool, others select a course and provider based on what they want to study and where they want to be while they are doing it.
Cynics will suggest a shiny new building or a good deal on accommodation will have at least as much impact on applicant choice as the research output of academics in “their” department. Lots of students have made course decisions on grounds that may seem spurious but have gone on to academic success.
There are issues with access to courses around where these are offered. We know, for instance that students from disadvantaged backgrounds are reluctant to travel far from home to study, and that the increasing concentration of “niche” courses in a few providers makes it harder for many applicants to consider. On the other hand, we clearly can’t have every course offered at every provider – and the benefits of access to a full specialised department above a single academic keeping a subject area live are many. It’s here that access and participation work needs to be doing some seriously heavy lifting – and I predict the next generation of A&P plans will focus a lot more on subject at quite a detailed level.
A-poaching we will go?
The idea of “poaching” suggests a world where an applicant would have chosen a particular course at a particular university had another, more attractive, course/university pairing not been made available to them. Here, for 2020 at least, this appears to be overstated – more than three quarters of 18 year old UCAS entrants went to their “firm” choice of course and provider, a very slightly higher proportion than in the 2019 cycle, but a lower proportion than in 2013. So, around three 18 year old UCAS entrants in every four chose and applied to a course, was given an offer on the course, and accepted that offer every year this decade.
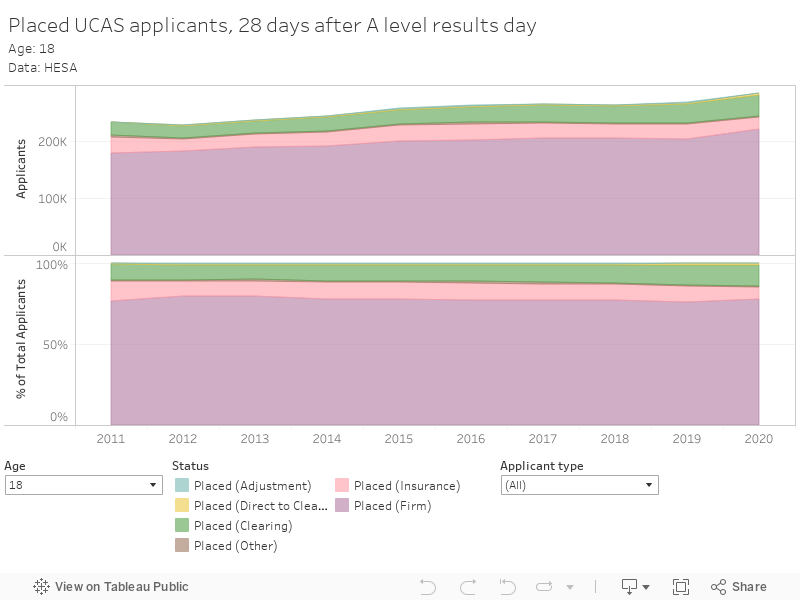
Putting that another way, there’s no evidence (in UCAS data, at least) of widespread “poaching” – which I’m defining as where a student had made a reasonably firm commitment to one course/provider but has ended up at another. There are gradual trends – larger providers are expanding faster than smaller providers – but seen alongside applicant placement data these are not evidence of direct “poaching” unless you happen to feel applicants are themselves making the “wrong” choices in the first place.
It is a mistake to see “extra” students as a resource that should be shared equally – applicants will apply to (and, three-quarters of the time, be accepted to) courses/providers that are best for them. Growth has always been asymmetric in higher education, do ask the “red bricks” about the Robbins expansions of the 60s, or the “pre-92s” about what happened when the former polytechnics entered the sector.
Terms and conditions
What it feels like to work in a particular department at a particular provider is not something that can be expressed with HESA data. Though we can talk about numbers and broad contract types, this doesn’t show instances where – for example – average rates of pay, or workload have changed over time. Neither do we see anything on morale or working conditions. To understand that, we can only listen to what staff are telling us, and you don’t have to spend very long around university workers to learn that many of them are unhappy – regarding pay, pensions, and working conditions.
So to present these graphs is not to trivialise what staff are saying, it is just an expression of publicly available information we can use to address a particular question – do subject areas that shrink over five years in terms of student enrollment also shrink in terms of staff numbers?
We’re immediately into the weeds of subject coding – staff numbers are expressed against “cost centres”, whereas student numbers were (until 2019-20) expressed against JACS principal subjects. It makes sense to think of staff as being attached to a department and students attached to a subject of study, but to properly interpret the impact of numbers of the second on numbers of the first requires some local structural knowledge that you don’t get from HESA.
Broadly speaking you can see “cost centre” data as relating to a school or faculty (or in some cases, a sub-level of either). Each faculty will make teaching contributions to a number of courses within that broad subject domain – and these courses may cover a number of distinct subject areas (consider, for instance, a module on “introduction to statistics for research methods”, or “introduction to critical theory”).
And it need hardly be added that subject coding (and cost centre coding) is an administrative convenience not a statement of universal truth.
Compare and contrast
So here is a plot of the change in student numbers by provider and subject area between 2014-15 and 2018-19 (top level JACS on one tab, Principal Subjects on the other):

And here is a plot of the change in staff numbers by provider and subject area between 2014-15 and 2018-19 (by HESA Cost Code):
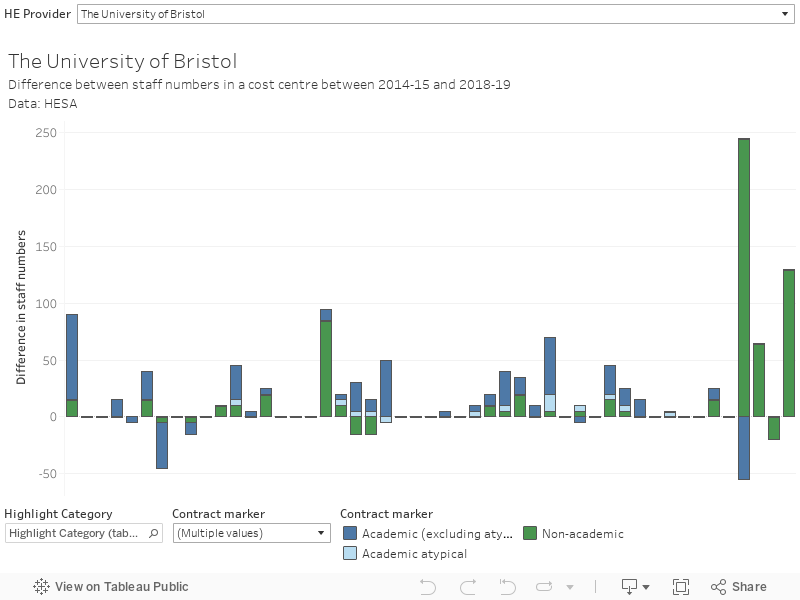
If we set both these to look at the same provider, we can start exploring our hypothesis. For instance, the University of Plymouth gained 35 members of academic staff in nursing and lost 30 members of academic staff in business and management studies – and if we look at the subject area graph we can see that Plymouth has an extra 130 FT UG students studying “subjects allied to medicine” (on the other tab, 115 FT UG “nursing students”) and more than 1,000 less studying “business and administration” (on the other graph 500 of these in straight-up “business studies”).
This gives you the tools to look at the department and courses that might make up your own life, but what can we say about the sector overall?
Contrast and compare
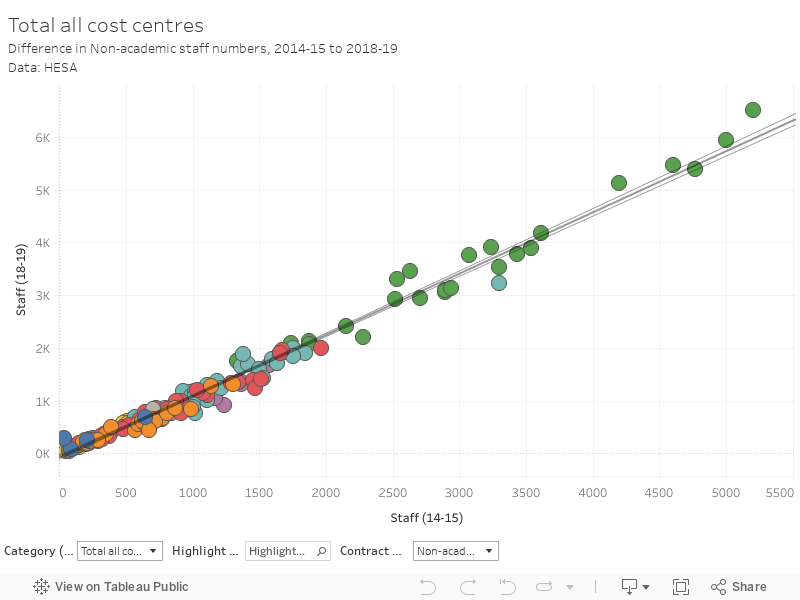
A scatter plot is a useful way of approaching this question in that we can quickly get a sense of volume, scale of change, and provider type – and understand sector-wide trends. So first up, here’s (non-atypical, academic) staff numbers between 2014-15 and 2018-19:
Quickly followed by FT UG student numbers over the same period:

These are both preset to look at nursing numbers (use the filters at the bottom of each to select a subject areas and cost centres of interest). To take the example of Anglia Ruskin – on the student numbers plot you’ll see that there’s more nursing students there than anywhere else, and a big chunk of this (nearly 1,200) has been added in the last five years. However, this has been accompanied by only a 35 person expansion in staff numbers.
Compare Swansea – a 300 student increase is backed by 100 new staff in the linked cost centre. Or York – down 125 students, up 25 staff. Or Hertfordshire, down 275 students, down 5 staff. So it looks very generally like there is some link between the direction and magnitude of change in recruitment and staff numbers, but this is by no means universal or predictable even in one quite discrete subject area/cost centre.
A university manager would argue that less students mean less work for staff to do – a good university manager would remember that rebuilding capacity if numbers turn round is more difficult and often more expensive than maintaining staff numbers during a lean year.
A plea for tolerance
For me, higher education has been a market ever since there was a respectable number of universities for applicants to choose between. What changed in 2004 and then 2012 was an attempt to add ideas of “price” (as charged to graduates) into the equation. Price has not empowered applicants to make choices based on quality, and has not worked as a differentiation between providers or courses. But the system has worked to allow popular providers and courses to grow, and has caused less popular providers and courses to shrink.
There was never a golden age without universities changing size and shape – offering new courses and closing old ones, rethinking the size and shape of departments and faculties. Number controls and ASNs were not a guarantee of job security for university staff. Though I’m attracted to a more controlled model of managing year on year difference between recruitment, I’d argue for a return of the HEFCE tolerance band rather than any change to what courses applicants are able to access. In other words, I wouldn’t use student lives as a means to solve a financial problem.
A tolerance band would provide at least a measure of financial sustainability to providers (not allowing income – or tapering income if you prefer – from undergraduate recruitment to change by more than 5 per cent between academic years) and thus remove immediate financial pressures on providers after a poor year of recruitment while discouraging rapid expansion outside of clearly defined exceptions. I’d also want to see it applied at a provider level to ensure senior managers consider the shape of an institution overall rather than leaving individual subject areas as hostages to fortune.
It’s really important that we consider the plight of university staff struggling with precarious employment or unreasonable workload, and the sector absolutely needs to get its house in order on terms and conditions. But a simplistic return of number controls within the current system is not a way to make this happen – what I think we need is a wholesale rethinking of funding mechanisms. The return of a tolerance band would be a stopgap, but it would at least preserve the principle that applicants are the best people to decide which university to attend and what course to study.


Remember that the different funding arrangements mean that controls on student numbers remain a key feature in the Scottish university system.
I don’t think the definition of “poaching” used here captures the problem.
Applicants are not lured away by providers they haven’t applied to (which is what’s being captured above), but by those in their application that they previously wouldn’t have had offers from, or offers that they felt were attainable.
It’s common (and sensible) for UCAS applications to contain both an aspirational choice and a backstop. Aspirational providers can increase their share of pool of applicants by e.g. discounting their published offer level to those candidates, thus making them seem more attainable and, effectively, poaching from other providers in the applicants list.
I had a crack at looking at this over on Wonk Corner. It turns out that selective providers have become more selective over time!
Speaking of Scotland @Colin Reid, last year’s mooted student number controls scared the living daylights out of Scottish universities. A slew of negative Scottish press blamed the UK Government for a reckless proposal. UCU Scotland were particularly vocal: https://www.ucu.org.uk/article/10806/UCU-Scotland-disconcerted-over-English-student-number-cap
So it’s incredible to see UCU giving this idea credence again. Their policy making is all over the place at present – as evidenced by the perverse support for PQA: another major financial risk at a time when the sector is reeling from the negative impacts of covid.