


The political mood music emanating from the Home Office to accompany this quarter’s immigration figures marks a sharp contrast from James Cleverly’s predecessor.
Commenting on the students in the numbers, he said:
The biggest drivers of immigration to the UK are students and health care workers – [they] are testament to both our world-leading university sector and our ability to use our immigration system to prioritise the skills we need.
The focus has moved away from temporary legal migration to illegal migration in a way that will cheer those who call for students to be taken out of net migration figures altogether:
“But we do need to reduce our overall numbers by eliminating the abuse and exploitation of our visa system by both companies and individuals.
But with the Government languishing in the polls, Farage about to emerge from the Australian jungle, the anti-immigration right on the rise across Europe and a set of stats that have revised up 2022’s annual net migration figures by a whopping 139k to 745,000, the pressure will remain on to “do something” about immigration.
So the question for universities is partly about whether Cleverly can, will or could hold his nerve. And the thing that increases the chances of that is also the thing that will be causing finance directors to panic – because the numbers for Q3 2023 suggest that the boom in international PGTs is slowing significantly.
Grants steady
For the year ending September 2023, there were 486,107 sponsored study visas granted to main applicants. That’s similar to the year ending September 2022 (up 2 per cent) but almost double (up 86 per cent) the year ending September 2019. That’s the impact of the graduate route post-study work visa.
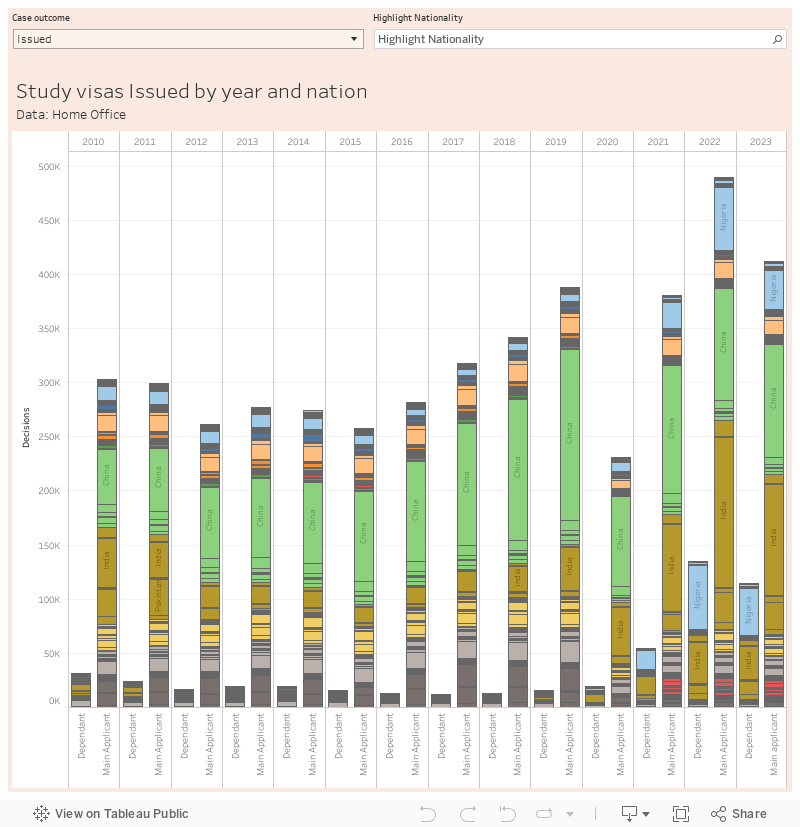
We can see a small year on year increase in grants to Indian nationals – around 5 per cent up on last year, though this means numbers now nearly 5 times higher than in the year ending September 2019. Indian nationals accounted for over one-quarter (27 per cent) of all sponsored study grants to main applicants in the latest year.
Chinese nationals were the second most common nationality granted sponsored study visas – 22 per cent of this year’s total, but down 7 per cent compared to the preceding year. Chinese and Indian nationals together comprised half of all sponsored study grants.
Nigerian nationals granted visas remained steady compared to last year – again this is around 8 times the number in the year ending September 2019.
Of the top 5 nationalities granted sponsored study visas, Pakistani nationals saw the largest percentage increase – up 33 per cent in the year ending September 2023.
Applications fall
Regular readers of Wonkhe will note that a full year, year on year, increase of just 2 per cent must mean a problem given that for the last three quarters we’ve seen major increases. And you’d be right.
In the vital pre-September quarter 3, applications for a study visa fell from 277,990 to 275,082 year on year. Some of that will be about students applying earlier for this September, but down in the country numbers there are major differences.
In that key quarter, there’s been an almost 25 per cent drop in applications from Nigeria – offset partly by a 4 per cent increase in applications from China and an over 30 per cent increase in applications from Bangladesh.
This chart shows annual figures on a comparable basis since 2010 – you’ll see both an overall decline, and particular sharp declines from India and Nigeria – even before the ban on dependents kicks in. The collapse of the Naira in Nigeria, and the cost of living crisis in the UK, is being blamed for much of the difference there this time around.
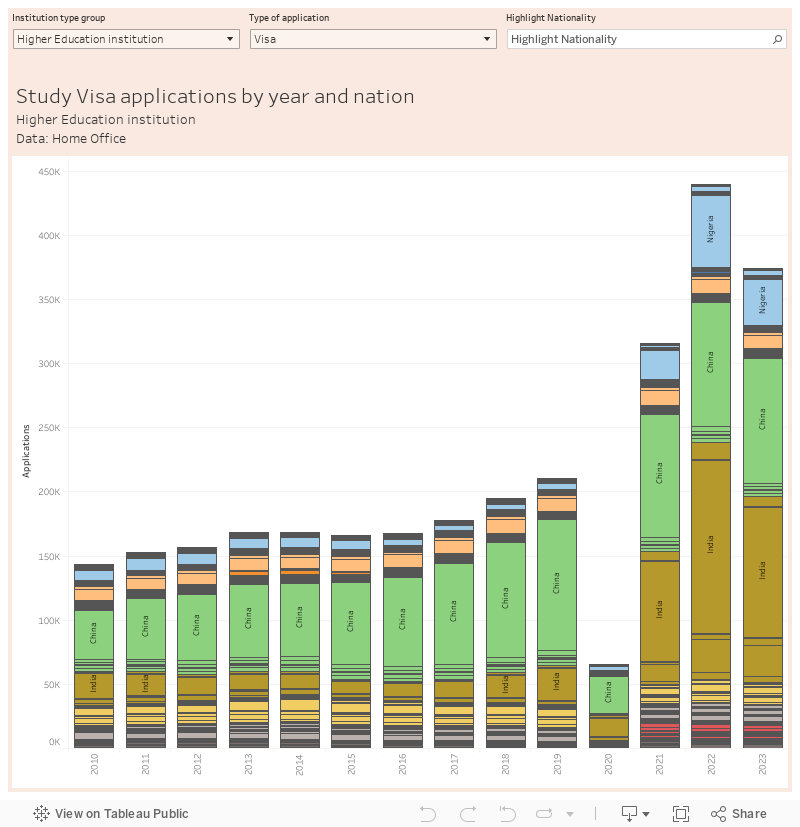
Those country differences will have contributed to major differences by provider – although one thing to note is that the split between Russell Group and non-RG visa applications (the only provider types that the Home Office issues data on) were identical at 42 per cent RG, 58 per cent non-RG.
It’s also notable that refusals are up in the quarter – from 1,673 in Q3 2022 to 5,092 to Q3 in 2023.
Dependant on the money
A big concern for the past couple of years has been dependants. Here again the full year graph looks like a continuation of a trend – but hides the Q3 story.
Q3 dependant acceptances are actually up from 55,856 to 56,699 – making the main ratios (number dependants per applicant) as follows:
- Average 0.19
- India 0.20
- Nigeria 0.92
- China 0.01
- Pakistan 0.39
- Bangladesh 0.56
That’s actually a fall for the previous biggest driver of dependant increase Nigeria – suggesting that “fears” of a bulge in dependant applications getting in ahead of the 1 January ban have been offset by financial concerns and negative mood music on the issue in the country.
Cleverly’s officials will know that the vast bulk of these will disappear from here on in – it’s whether he’s able to explain that in any clarity as the furore over migration in general continues.
One other interesting aspect of the published figures is the numbers actually taking up the Graduate Route – a total of 104,501 Graduate route extensions were granted to former students in the year ending September 2023 (excluding dependants), up from 59,937 Graduate route extensions in the year ending September 2022. That’s not a marked increase in uptake – it’s a facet of the huge increases in students in the previous year(s).
Indian nationals represented the largest group of students granted leave to remain on the Graduate route – representing 43 percent of grants.
Where do they end up?
All of that is just people coming in – those worried more about long term population growth and less about student accommodation are inevitably more concerned with net migration.
Understanding what international students end up doing is complex – and it is heartening to see that even the ONS has been struggling to do this. What we want, ideally, is a projection mechanism that would tell us how many students are likely to complete their course, and how many are likely to go on to graduate employment. Office for Student condition of registration B3 data, basically.
OfS uses cohort data to generate benchmarks in order to do this, taking into account the demographic and subject area make up of recent and current students. For continuation and completion data, they look at the behaviours of a particular cohort (that started the same course at the same time) rather than the outcomes of all students). In a nutshell, this is the approach ONS are moving towards in the most recent experimental data.
This is all well and good where behaviour remains consistent, but ONS are starting to see a change in student visa holder behaviour. Over the period of pandemic restrictions, international students were more likely to return home than stay in the UK – since then, we have seen (via the cohort method) a growth in the number of international students transferring to a new (graduate, work, or graduate then work) visa.
What the data really tells us
The issue here is that such intelligence is retrospective. If you look at a three year undergraduate moving to a two year graduate visa, the earliest usable intelligence we can get is from those starting their course in 2018.
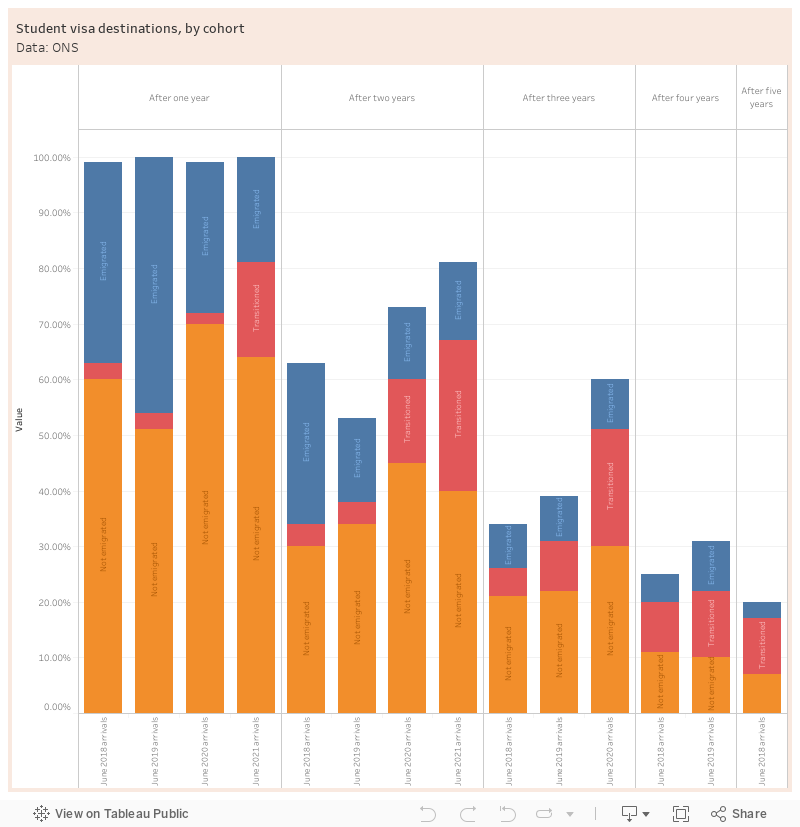
This experimental data highlights the issue – 2021 arrivals look like they will be more likely to transition to another kind of visa than recent cohorts. You would expect this due to the end of pandemic restrictions (and the wider availability of work), but there are also underlying changes to the demographics of students (different courses, different subjects, different ages, and from different parts of the world) that could also be playing a part.
Certainly, universities and representative bodies may be willing to cite that 2018 cohort data that suggests 81 per cent of international students had emigrated five years on – while those arguing for a more hawkish approach to international recruitment would note that 36 per cent of that cohort had emigrated after one year, whereas the comparable figure for the 2021 cohort is just 19 per cent.
What matters overall is that however you cut it, they are staying longer – and it’s much more difficult to just “lift” international students from net migration figures than some suggest.
Facing the music
So where does that leave us? At least for the time being, the sector can probably breathe a sigh of relief on further immigration restrictions on international students – it has a Home Secretary who’s keen to talk up the contribution, and Cleverly probably has enough signals in the noise to be confident that numbers are under control, and will fall further.
But out in universities themselves, things are tougher. Every day this month seems to be bringing a new announcement on cuts and closures – and each time the talk surrounds universities undershooting recruitment targets this summer. If Covid and furlough masked a problem in 2020-21 and international PGT masked it in the last couple of years, the luck has very much run out for some providers battling a declining real-terms unit of resource and costs and burdens that keep increasing.
Further trouble could still be ahead too. Around the sector I hear that international student attendance and students actually paying their fees are a growing concern – again, inevitable at aggregate level given the contrast between the messages that adverts and agents will have been giving about affordability – and the realities of a cost of living and accommodation/rent crisis in multiple cities. If that all adds up to lots of drop-out, that will translate into an immigration issue, a regulatory outcomes issue, and a major reputational issue for the countries where that problem bites.
And there are still persistent questions that concern several universities adapting to the new normal of thousands of international PGTs settling into both student and local communities on little notice – all with little planning for educational, social, health or future employment needs – and further falls to come via that dependant ban. So while the party isn’t quite over, it looks like there’s lots of facing the music to be done in the coming months.


“The biggest drivers of {legal} immigration to the UK are students and health care workers – [they] are testament to both our world-leading university sector and our ability to use our immigration system to prioritise the skills we need.”
We as a sector need to ensure the facts about dependents are accurate and the politicians don’t muddy the water by linking students with dependents to {skilled worker route} health care workers and their dependents, one group entering under that scheme, which exempts their dependents from the immigration health surcharge, are reportedly bringing in an average of 4 dependents per worker!
“For the year ending September 2023, there were 486,107 sponsored study visas granted to main applicants”
I’m confused. The chart shows around 410,000?
To answer my own question, I see that the chart is showing calendar year vs the text realting to 4 quarters ending September (Q3 2023)!
Our university has seen an increase in Nigerian nursing students doing PG but leading to becoming registered nurses.
And most are female with dependents.
Clearly they help both education and health
And will now stop coming.
Not going to help our health service
Not the Nigerian one if they return
It would be interesting to know the breakdown by profession to see where this will impact