The government has released new Longitudinal Earnings Outcome (LEO) data. It’s a rich data set which asks more questions than it answers. However, there’s a great deal of interesting early conclusions to draw.
Read our overview of the release, the context for publication, the caveats for its use in research and policy and what’s next for the data agenda.
Lesson 1 – look beyond the initial data tables
One of the quirks of how today’s data has been presented is that there is significant variance between different institutions of whether their graduates have been picked up by LEO and are instead marked as ‘activity not recorded’. These are graduates who have been matched to the DWP’s systems but have no employment or benefits record or further study in the tax year of interest, and range from 25% of graduates (five years out) at Birkbeck and London Metropolitan to 6.4% at De Montfort.
The explanation for non-captured graduates from DfE is as follows:
moving out of the UK after graduation for either work or study, being self-employed in the relevant tax year, earning below the Lower Earnings Limit, or voluntarily leaving the labour force
However, this ends up distorting the overall data picture (damn emigrants, messing up our datasets…) as it is first presented. A better ‘league table’ of employment and further study outcomes should remove the graduates not captured by LEO and instead measure only those who have been. If we do this, we get the following ‘top and bottom’ lists of institutions by percentage of graduates in sustained employment or further study five years after graduating (2008-09 cohort).
| Institution | % employment or further study 5 years after grad |
|---|---|
| Royal Northern College of Music | 97.0% |
| Guildhall School of Music and Drama | 96.4% |
| Trinity Laban Conservatoire of Music and Dance | 96.0% |
| University of Worcester | 95.1% |
| Rose Bruford College | 94.6% |
| Conservatoire for Dance and Drama | 94.4% |
| The University of Lancaster | 94.1% |
| The University of Bath | 94.1% |
| The University of Surrey | 94.1% |
| University of Gloucestershire | 94.0% |
| University of Cumbria | 93.9% |
| Teesside University | 93.% |
| University of Chester | 93.9% |
| The University of Chichester | 93.8% |
| The University of Keele | 93.8% |
| University of Durham | 93.6% |
| Institution | % employment or further study 5 years after grad |
|---|---|
| London South Bank University | 88.0% |
| Royal College of Music | 87.8% |
| The University of Buckingham | 87.5% |
| The School of Oriental and African Studies | 87.2% |
| The University of East London | 86.0% |
| Norwich University of the Arts | 85.7% |
| London Metropolitan University | 84.7% |
| Harper Adams University | 84.6% |
| The Royal Veterinary College | 84.5% |
| Newman University | 84% |
| Royal Academy of Music | 83.8% |
| Courtauld Institute of Art | 82.2% |
| St George's Hospital Medical School | 82.0% |
| Writtle College | 81.2% |
| Bishop Grosseteste University | 91.0% |
| Royal Agricultural University | 80.8% |
| Heythrop College | 73.2% |
Also towards the bottom are some surprises including Queen Mary, LSE and Imperial, and indeed London institutions, on the whole, appear to have lower proportions of graduates in employment or study, with or without those not recorded by LEO. This seems a similarly odd trend to that of London institutions scoring particularly poorly on the NSS, and there is as yet no credible explanatory hypothesis that comes to mind. Are these institutions more likely to have graduates which “undertake activities after graduation that the data does not capture well, for example self-employment or working abroad”, to quote DfE?
Suggestions in comments perhaps.
Lesson 2 – Prior attainment matters. A lot. No really, A LOT!
One of the more insidious potential uses of this data could be to reform university funding or ratings of teaching excellence around LEO demonstrated outcomes. The ins and outs of this have been addressed elsewhere, but let’s just go so far to say that any reading of this data must clearly account to some extent for the attainment of graduates before entering university (in most cases, at school).
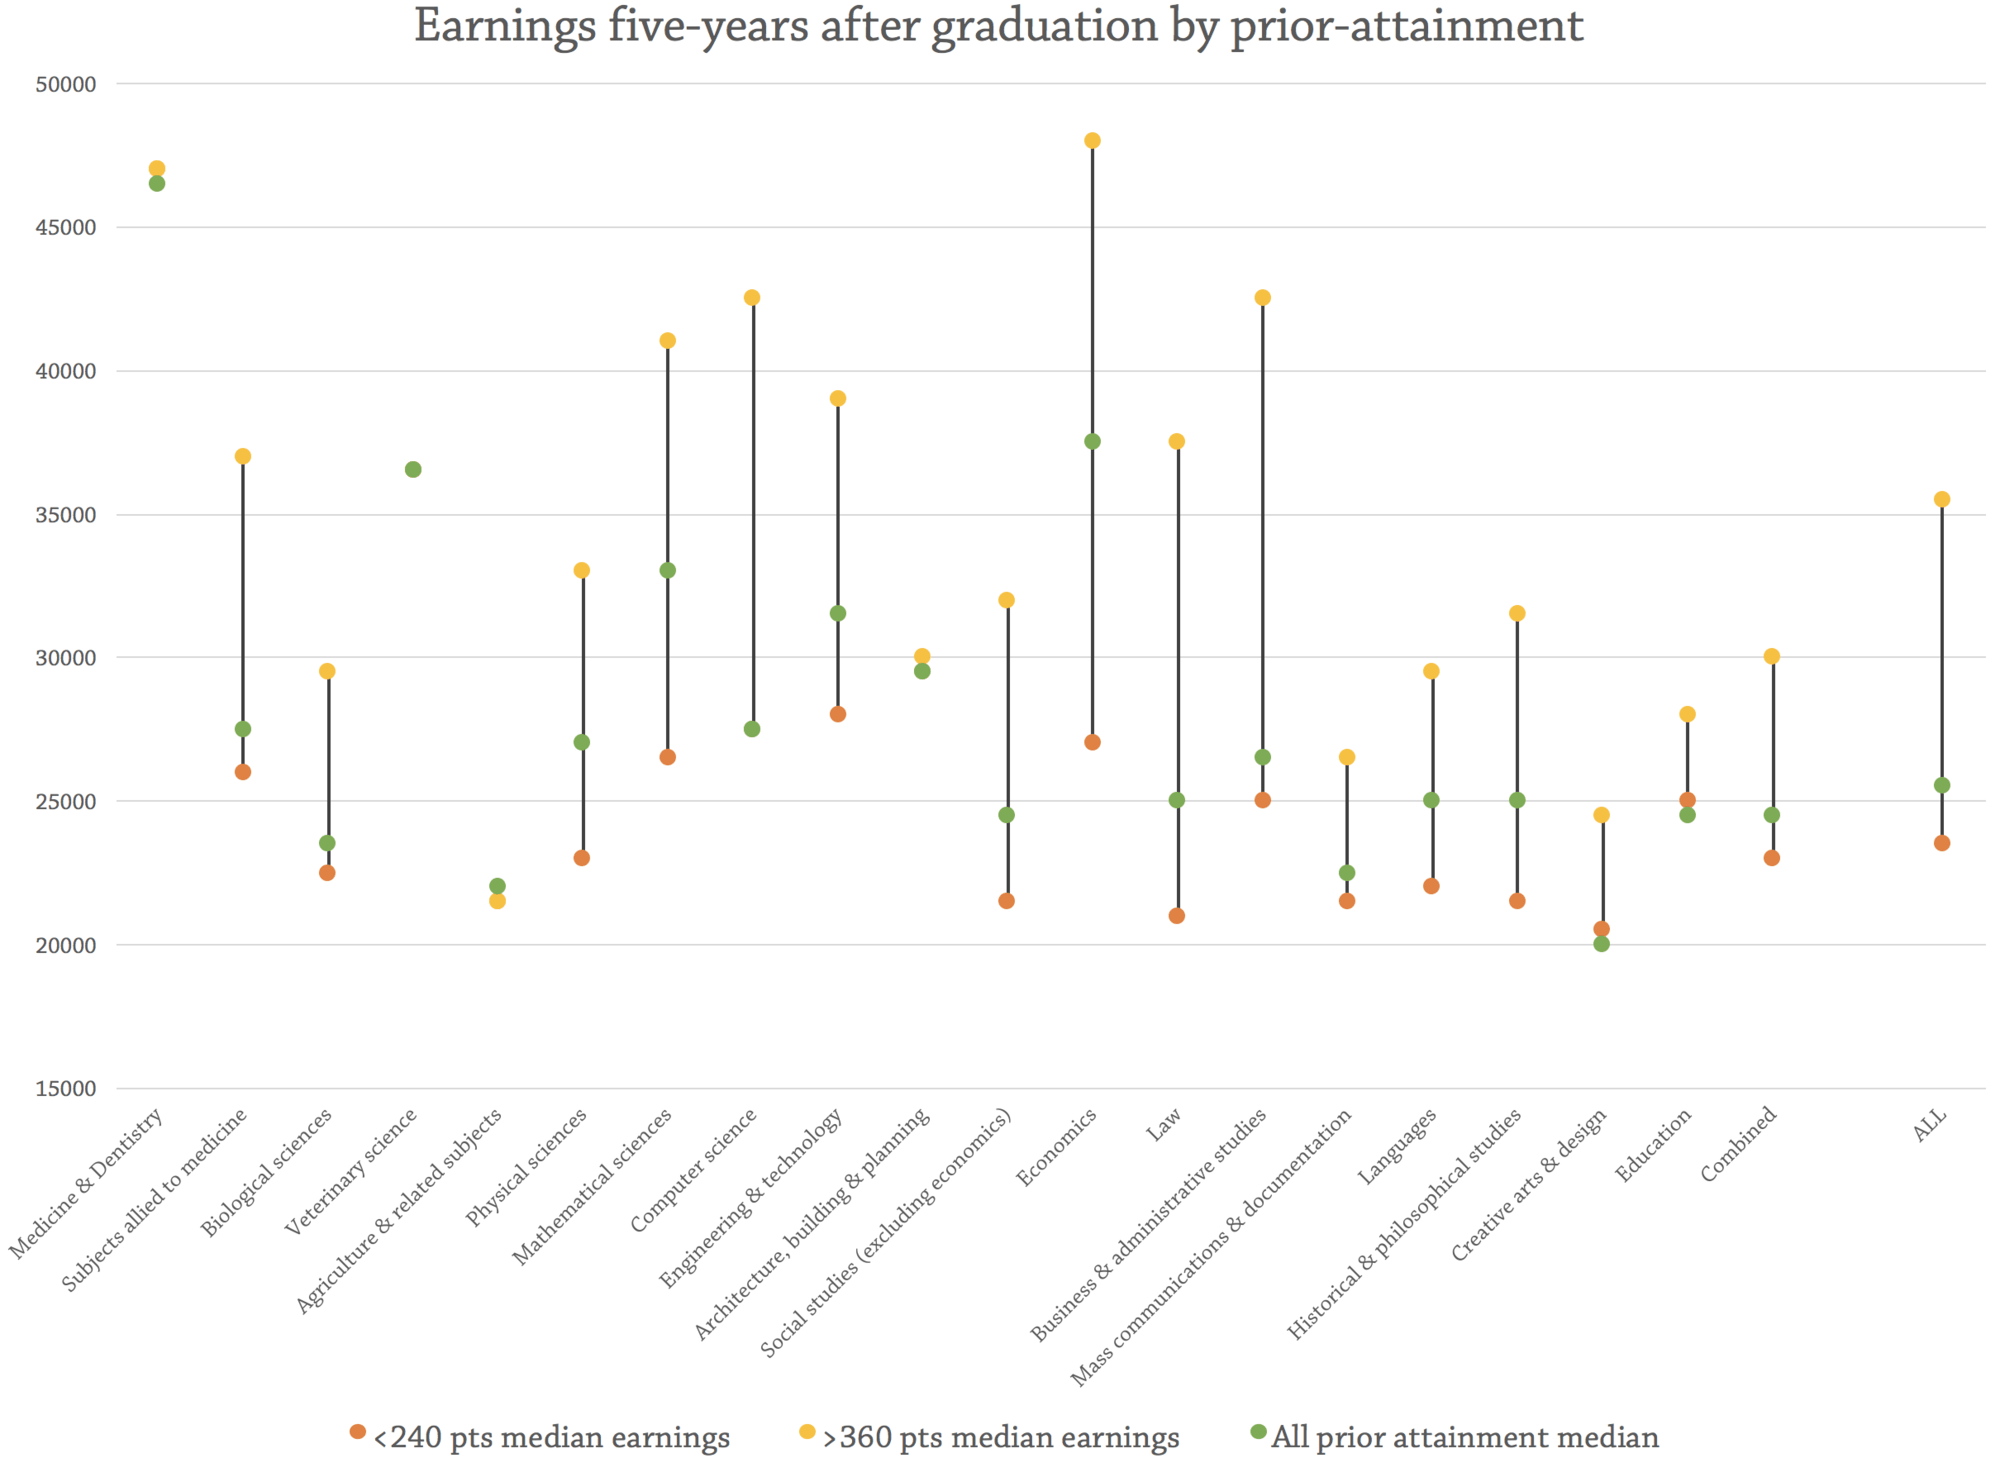
As the graph shows below, there is enormous variance in earnings outcomes between the highest achievers at A level (or equivalent) and the lowest achievers. Outside most the specialist sectors such as medicine, veterinary, architecture, and education, high ‘prior attainers’ will always outperform ‘lower attainers’ regardless of the subject studied. If you’re going to university on a low tariff, unless you are accepted onto one of the aforementioned subjects (in most cases very, very difficult), you are very likely to earn less than high attainers regardless of the subject studied.

What’s also interesting is how much these variances differ by subject, and in some instances, they give us a clue as to the nature of supply and demand in certain sectors and professions. Variances are lowest in education, medicine, veterinary, agriculture and architecture, suggesting that employers of relatively well-paid jobs in those sectors cannot afford to be picky about prior attainment when it comes to taking on graduates. Education seems a classic example, with the well-publicised warnings of a teacher shortage.
However, other professions clearly can be very picky about prior attainment and institution studied at when it comes to the top-paying jobs, most obviously in law and economics. The gap between the highest and lowest prior-attainers in these subjects is two-thirds of the average salary, which is enormous. The comparable gap in education is 12%.
Lesson 3 – The legal profession is oversupplied, but that doesn’t mean you shouldn’t study law
DfE made a curious choice to experiment with how it might present full subject-specific LEO data broken down by institution in the spring, picking law. The law is a profession-specific subject, and as we have already seen, is highly stratified. It has its own particular routes into the profession through the qualifying courses to be a solicitor or barrister taken after graduation, and many graduates enter it having not studied the subject at undergraduate level.
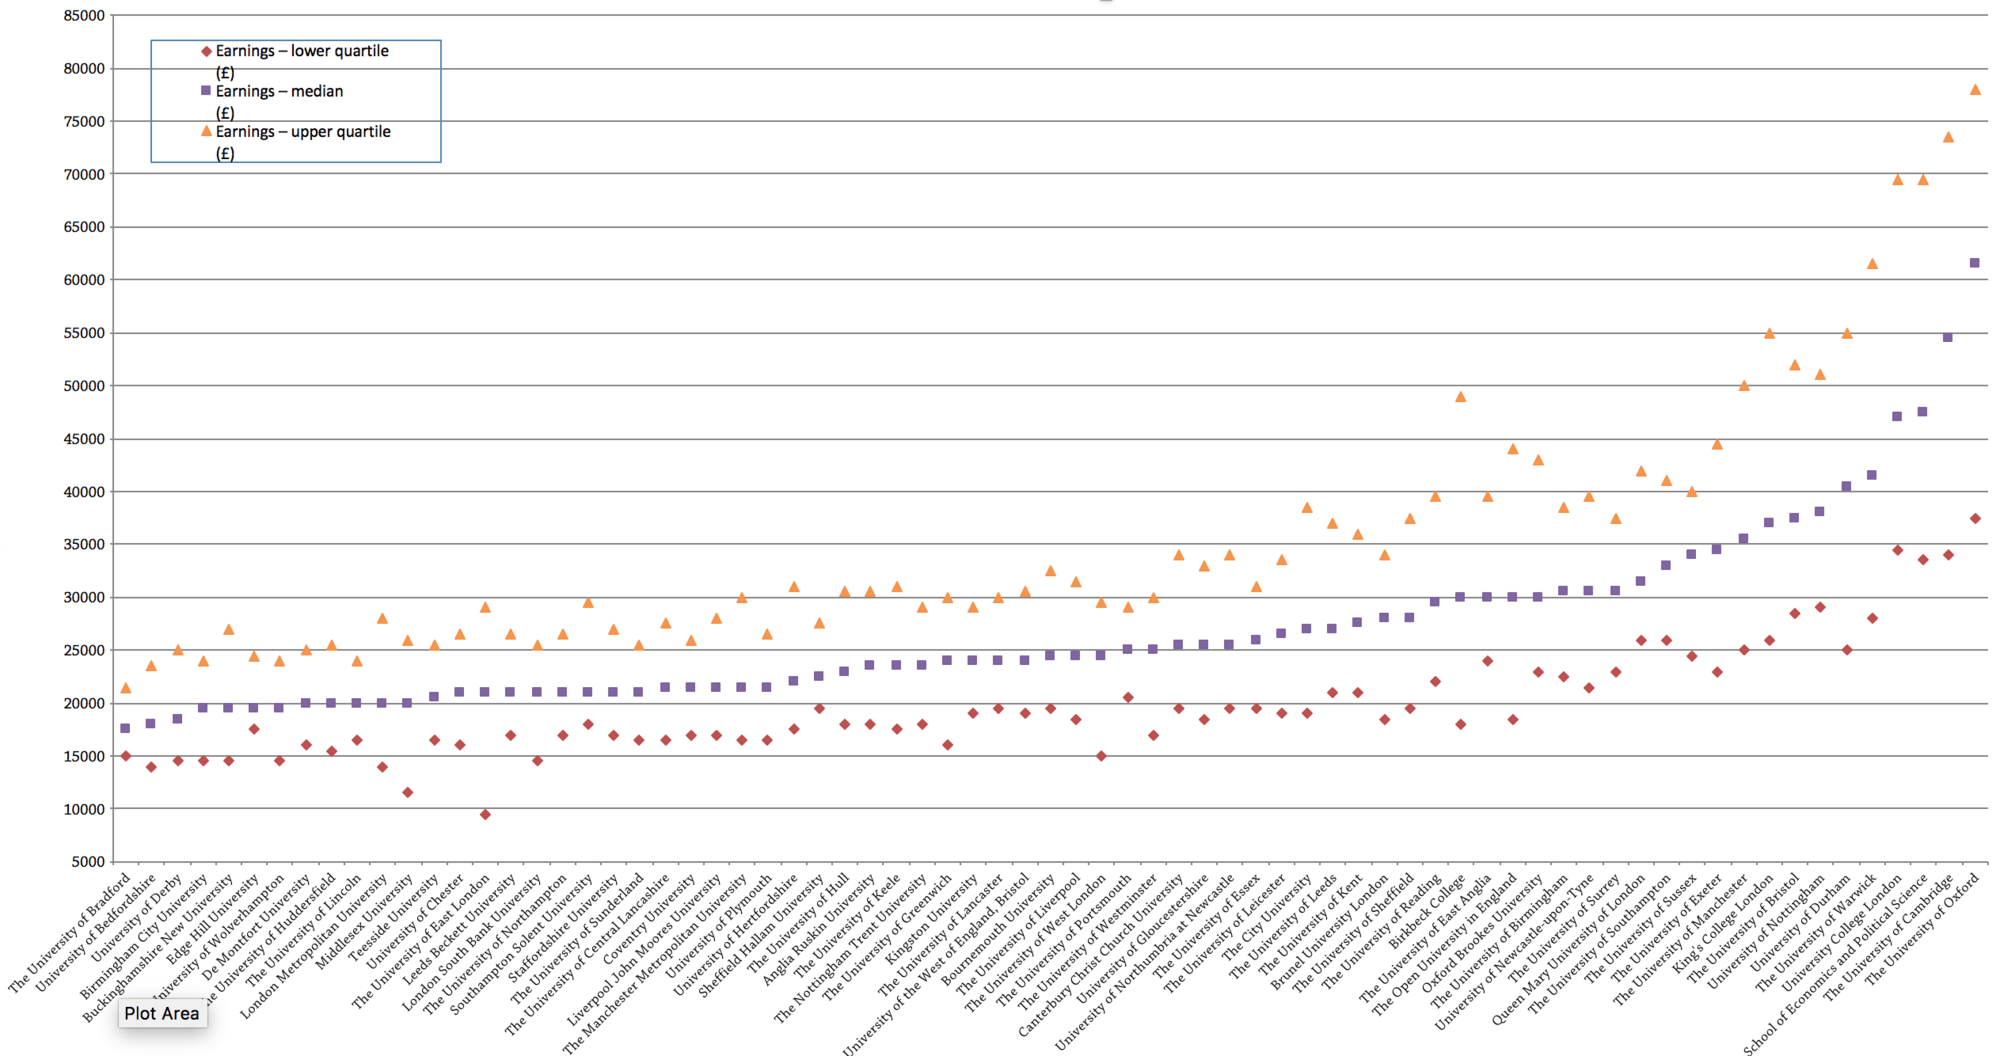
DfE also marked out the ‘most selective’ institutions from less selective ones and the reason why is clear. The average of each selective institutions’ median earnings data is 156% of the comparable average for less selective law courses. The lower quartile of law graduates at the University of East London are earning £9,500 or less five years after graduation, compared to the upper quartile of Oxford law graduates earning at least £78,000.
| Earnings – lower quartile (£) | Earnings – median (£) | Earnings – upper quartile (£) | |
|---|---|---|---|
| Av. of 'selective' institutions' median | 25200 | 35260 | 47400 |
| Av. of 'non-selective' institutions' median | 16958 | 22604 | 29281 |
| All | 18500 | 25000 | 34500 |
Even with the ‘most selective’ group, there is a massive range of earnings outcomes. The median earnings of law graduates at Oxford, Cambridge, LSE and UCL, is twice that of Liverpool, Lancaster and Leicester graduates.
| Most selective' law courses | Earnings – lower quartile (£) | Earnings – median (£) | Earnings – upper quartile (£) |
|---|---|---|---|
| The University of Oxford | 37500 | 61500 | 78000 |
| The University of Cambridge | 34000 | 54500 | 73500 |
| LSE | 33500 | 47500 | 69500 |
| University College London | 34500 | 47000 | 69500 |
| The University of Warwick | 28000 | 41500 | 61500 |
| University of Durham | 25000 | 40500 | 55000 |
| University of Nottingham | 29000 | 38000 | 51000 |
| The University of Bristol | 28500 | 37500 | 52000 |
| King's College London | 26000 | 37000 | 55000 |
| The University of Manchester | 25000 | 35500 | 50000 |
| The University of Exeter | 23000 | 34500 | 44500 |
| The University of Sussex | 24500 | 34000 | 40000 |
| The University of Southampton | 26000 | 33000 | 41000 |
| Queen Mary University of London | 26000 | 31500 | 42000 |
| The University of Birmingham | 22500 | 30500 | 38500 |
| The University of Surrey | 23000 | 30500 | 37500 |
| University of Newcastle-upon-Tyne | 21500 | 30500 | 39500 |
| The University of East Anglia | 24000 | 30000 | 39500 |
| The University of Reading | 22000 | 29500 | 39500 |
| The University of Sheffield | 19500 | 28000 | 37500 |
| The University of Leeds | 21000 | 27000 | 37000 |
| The City University | 19000 | 27000 | 38500 |
| The University of Leicester | 19000 | 26500 | 33500 |
| The University of Liverpool | 18500 | 24500 | 31500 |
| The University of Lancaster | 19500 | 24000 | 30000 |
Or expressed in a chart (click on the image to open a full-size version in a new window):
It is clear that there is a massive oversupply of law graduates compared to the top or even ‘averagely paid’ (for a lawyer…) jobs available. Does this mean that a large amount of law courses are unviable and that law courses are pointless? Probably not.
The median earnings for all law graduates five years after graduation are still £25,000, higher than the national median household income (currently £23,500). At less selective institutions, the average of their median graduate salaries (a rough measure admittedly but the best that can be done with the data available) is £22,600, still roughly on par with the national median. A law degree at most universities looks unlikely to secure you a job at one of the UK’s top law firms, but it will still give you a good chance of earning more than most non-graduate wage earners.
Lesson 4 – The gender pay gap starts immediately after graduation
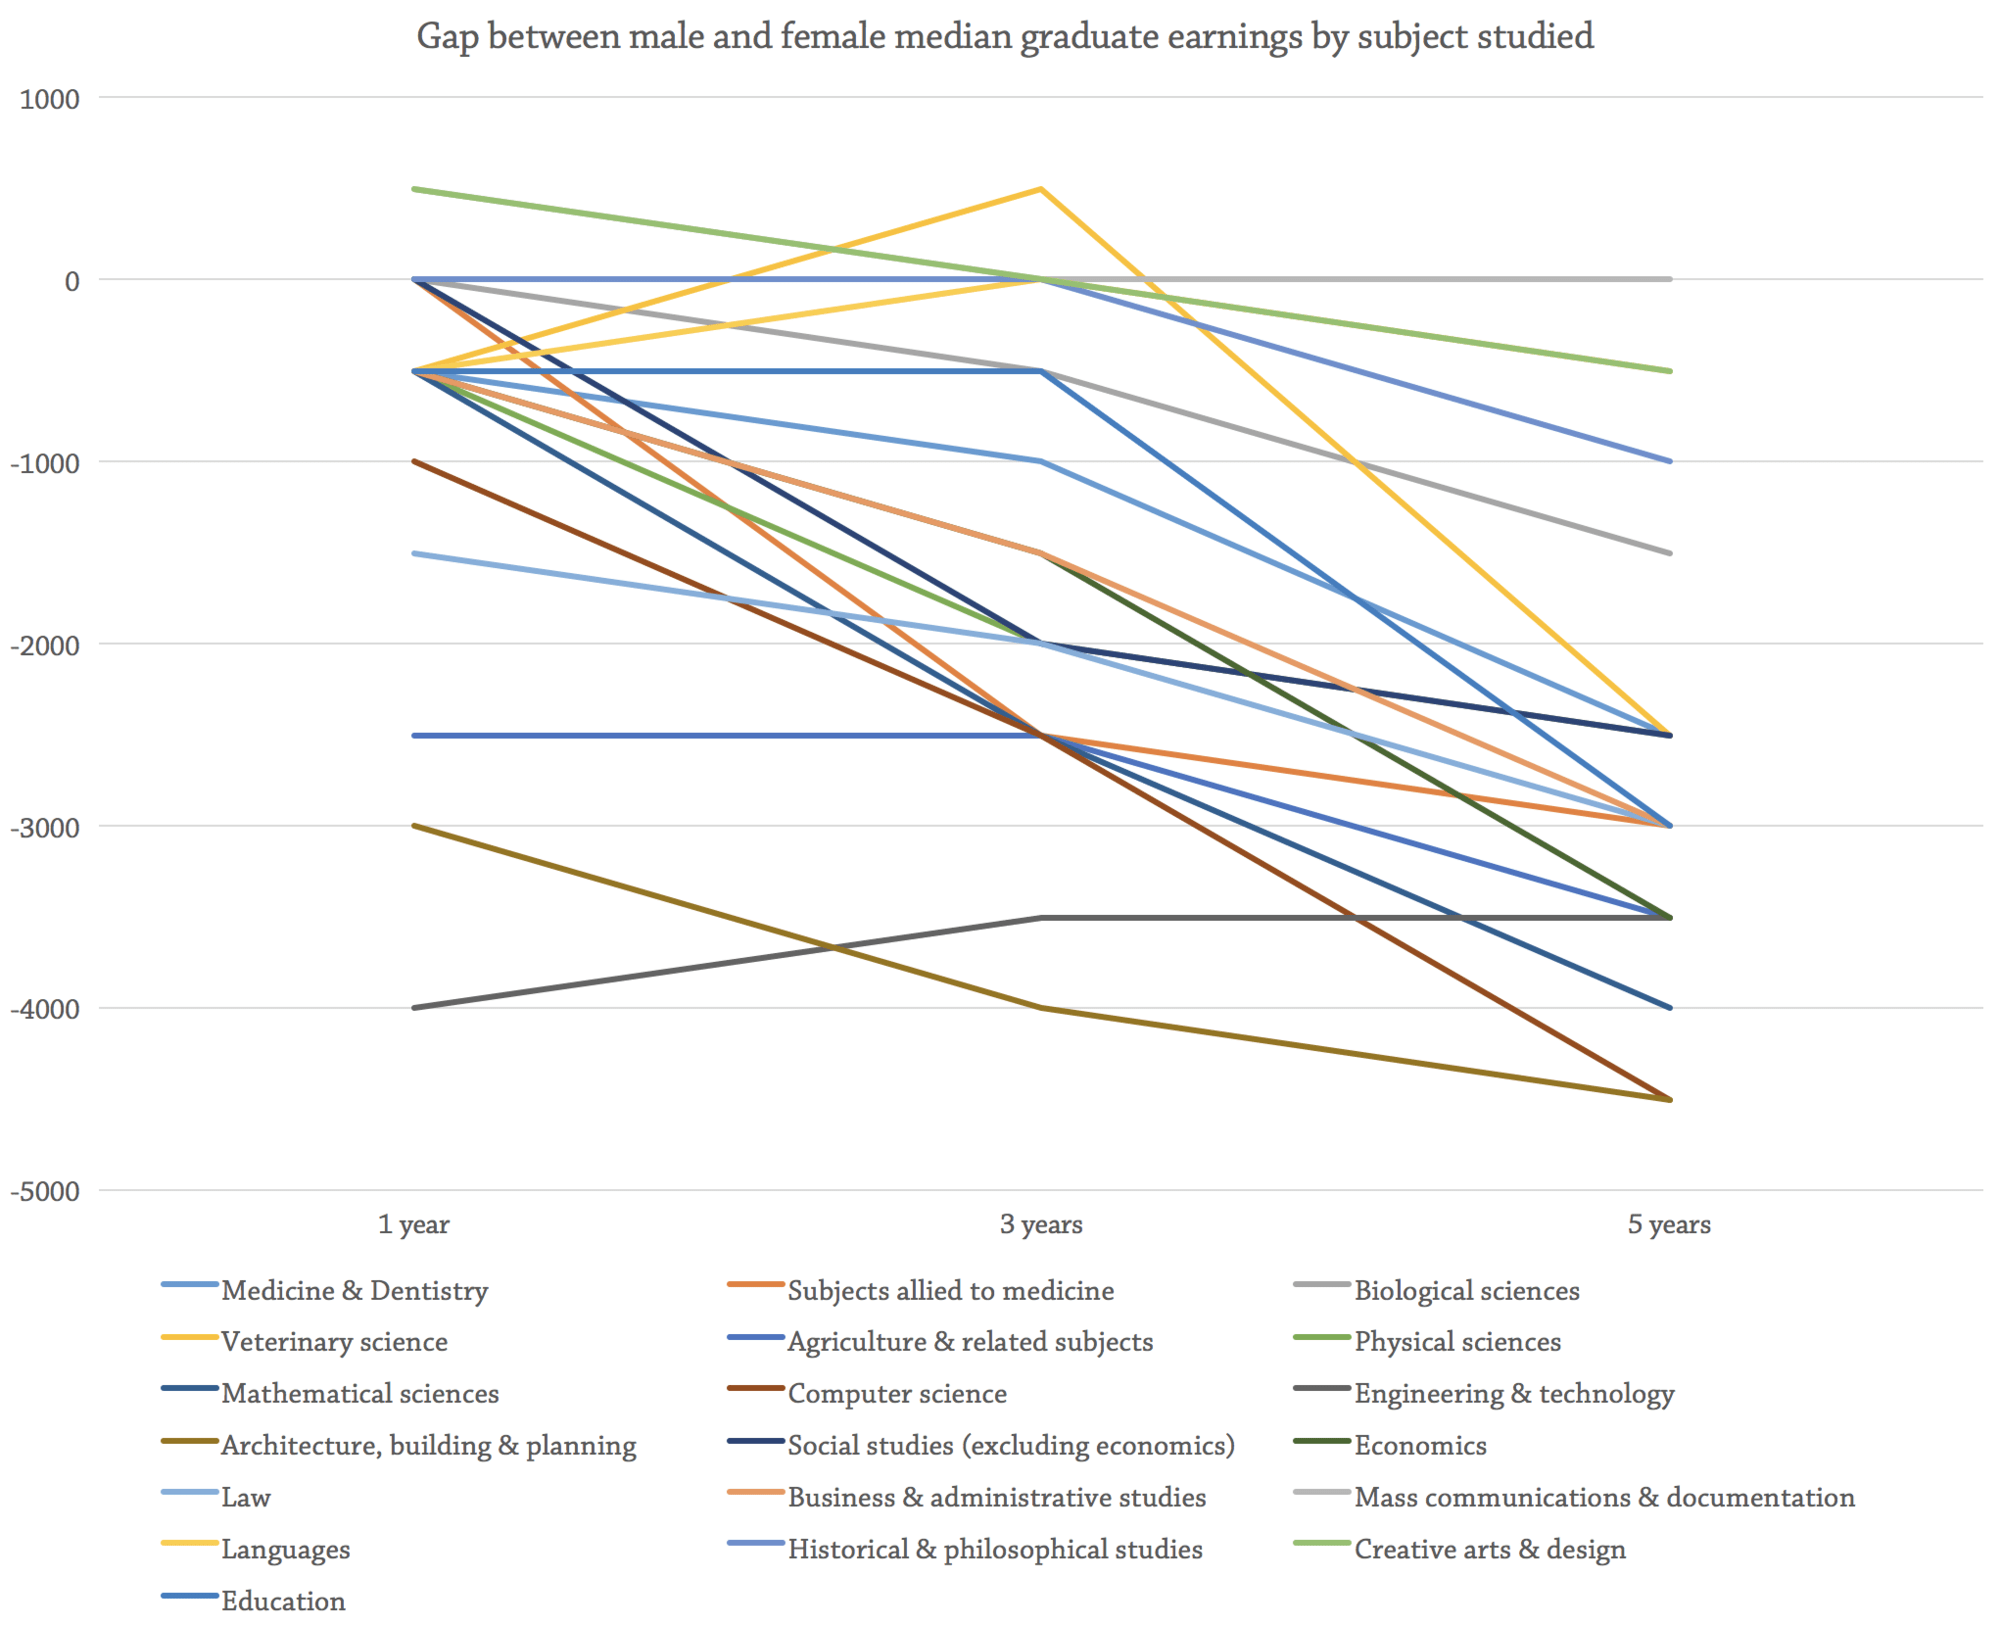
This is not exactly news, and many other surveys and pieces of research have shown the same, including the IFS initial big study into LEO data back in the spring. Yet the numbers are still startling, and also show significant variances by subject.

There are a couple of particularly interesting cases such as engineering, where the gap starts very high and appears to decrease slightly, but on the whole, the gap appears to start straight away and continue to grow. There has been a great deal of anxiety recently that men are falling behind women when it comes to university access, but this is far from the case when it comes to earnings after graduation.
And yet, in spite of all this, the overall graduate premium is still higher for women than it is for men because non-graduate wages for women are so low.
Lesson 5 – The gender gap is even more striking when combined with race
White men are even further ahead when compared with women of ethnic minorities, a particularly insidious aspect of what is also a more general ‘race pay gap’ amongst graduates. Female Pakistani graduates’ median graduate salary three years after graduation is an astonishing £6,500 less than the White males, compared to ‘only’ a £2,000 gap for White females.
| Difference in median earnings with White group | Difference in median earnings between females and White male group | Difference in median earnings within each ethinicity | |
|---|---|---|---|
| White | 0 | -2000 | -2000 |
| Black or Black British - Caribbean | -2000 | -3500 | -500 |
| Black or Black British - African | -1500 | -3500 | -1000 |
| Other Black background | -1500 | -3000 | 0 |
| Asian or Asian British - Indian | 500 | -2000 | -3000 |
| Asian or Asian British - Pakistani | -3500 | -6500 | -3500 |
| Asian or Asian British - Bangladeshi | -2500 | -5000 | -2500 |
| Chinese | 1000 | -1000 | -1500 |
| Other Asian background | 2000 | 0 | -1500 |
| Other (including mixed) | 0 | -2000 | -2000 |
| Not known | 0 | -2500 | -2000 |
It is particular groups of ethnic minorities that appear particularly vulnerable to being disadvantaged: Pakistani, Bangladeshi, and Black Caribbean. These are also the groups most prone to struggle with low well-being at university (see HEPI-HEA report) and to get in, in the first place. By contrast, Chinese graduates tend to outperform all others.


“Variances are lowest in education, medicine, veterinary, agriculture and architecture, suggesting that employers of relatively well-paid jobs in those sectors cannot afford to be picky about prior attainment when it comes to taking on graduates.” This may in part be true (e.g., for education) – but much of the difference is more prosaic – there simply isn’t much variation in prior attainment between students in medicine, veterinary science etc. – and thus it is is mainly a ceiling effect.
One of the most worrying implications of this kind of data analysis is that it perpetuates two features of questionable virtue: 1) that earnings through the life-course are a worthy measure of the value of higher education study, and 2) that attainment – whether prior or otherwise – is a simple and discrete indicator useful for establishing causal relationships with life-course outcomes.
As we state in the accompanying article on LEO, this is not an attempt to find causal relationships because it is not a full regression analysis that controls for multiple variables. I’ve tried to avoid conclusions on absolute causality and phrase my conclusions probabalistically, though as it happens, they do align with what the IFS found in a far more thorough analysis back on April. On the merits of LEO and earnings as an absolute measure of value in HE, I make no claim of the sort. If anything, I believe LEO shows us that to do so would be… Read more »
Ha, yes but (perhaps unfortunately, perhaps inevitably) vast proportions of students / potential students see it largely in those terms.
The methodology in relation to prior attainment is flawed as it depends on students being matched against the National Pupil Database. This was created in 2002 and stores data on the KS5 qualifications of 16-18 year olds in England only. In other words, if you were born before 1984 or took your qualification outside of England, you would not be matched within this particular data set. For mature learners, many of whom come to HE with non-traditional qualifications or, indeed, no qualifications at all, this means that the ‘prior attainment’ figures and analysis do not demonstrate the full picture and… Read more »
Hi David, great post. I may have missed a trick, but the data does not make a distinction between part-time and full-time earnings, it is simply the aggregate earnings with no regards to hours – Unlike data from the ASHE survey. When gender pay gaps are taken from the ASHE they use a like for like measure – the headline ONS measure is median hourly pay. Therefore the increased gap between male and female earnings over time may represent more females in part-time work. Also you haven’t indexed to inflation and the later nominal amounts are actually worth less in… Read more »
These are all excellent points. I hope DfE are reading as they prep the full release in the Spring.