


The details around the next steps of the TEF subject pilot has one glaring omission. Grade inflation – after a brief, supplementary, appearance last year – will no longer play a part.
Described as “unhelpful” within the context of subject TEF, the plan was that it would return to provider-level TEF, as “panellists found the metric was limited in its current form, suggesting it is not precise enough to enable them to make judgements about why grades may have risen”. There were suggestions that accounting for prior attainment was one aspect where the metric could be improved. None of this, of course, stopped DfE from trumpeting how this consultation response meant that grade inflation was being clamped down upon. Grade inflation is always good for a headline.
The UK Standing Committee for Quality Assurance has since commissioned Universities UK, GuildHE, and QAA to write a report on grade inflation in the form of a consultation paper, to which responses are currently being sought. Meanwhile, as the TEF documentation made clear, OfS would work on refining the abandoned TEF measure for it’s own regulatory purposes.
This work will be used by the OfS to inform its regulatory approach to addressing grade inflation. One of the four primary regulatory objectives of the OfS is to ensure that ‘qualifications hold their value over time’ and this objective is underpinned by a condition for registration that is applied to all providers.
Now read on
Which brings us neatly to today, and a short technical report from OfS that purports to offer a more accurate metric for the grade inflation “crisis” that is currently engulfing the sector. To cut a long story short, it doesn’t – and the way it has been presented and trailed is actively occluding our understanding of the issue.
Readers will now realise that I’m about to lay in to the methodology – so let’s get a few things up front first. The sector does have to deal with the problem of grade inflation – anyone who spends any time at all talking to academics and administrators knows that it is happening, though often in less visible ways that could be (and are often) argued to be attempts to more accurately reflect the work submitted by students.
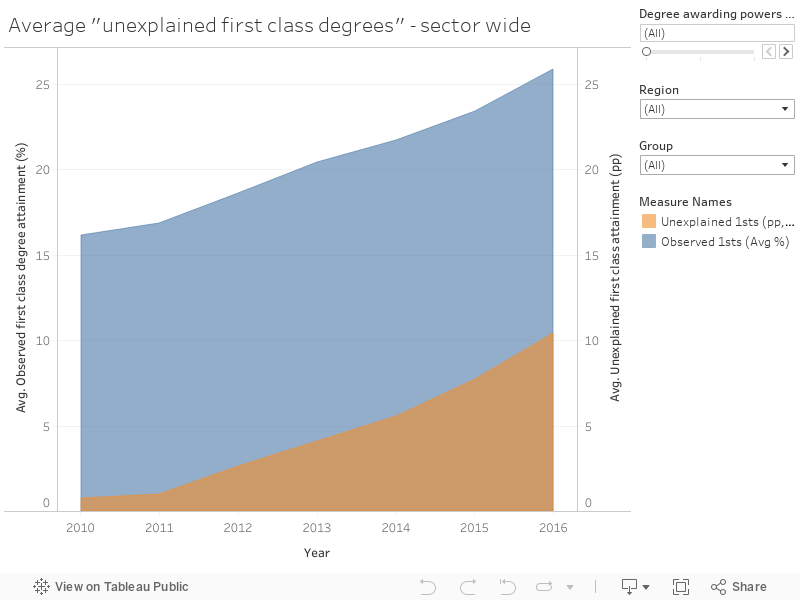
As far as we can have an “explainable” proportion of first class degrees, the Office for Students is wringing it’s hands over the growth in the number of “unexplained” first class honours for each institution since the class of 2010-11. According to the data (and the assumptions underpinning it), nearly all of the rise in the proportion of first class degrees is “unexplained”. This sounds like a big problem, but there are (yes) some questionable aspects to the methodology.
The first of these is the choice of 2010-11 as “year zero”. It’s arbitrary to the extent that TEF3, earlier this year, used 2007-8 as a comparator year. There’s no particular reason to assume that the right number of graduates got first class honours in 2007-8 or 2010-11, or any other year. Seven years of data isn’t a magic number – some institutions would have changed radically in size and subject mix over this period, others would be broadly the same. But an inflation measure needs a baseline and a bit of information about why this was chosen might have helped. One is tempted to suspect that the data beforehand was embarrassingly poor quality.
Characteristic assumptions
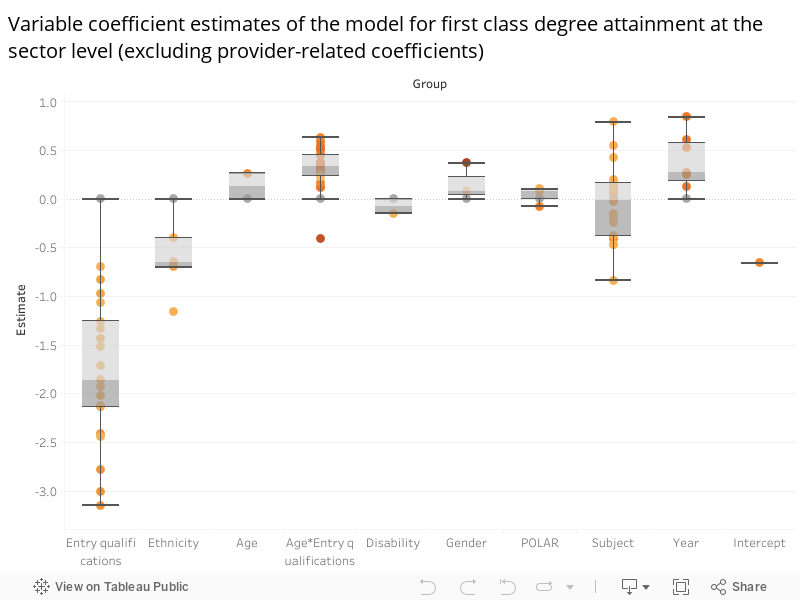
What the OfS analysis does next is to look at attainment by demographic characteristics. From this it can calculate the effect that each characteristic would have, and estimate a variable co-efficient for each. This gives evidence for some of HE’s darker little secrets – Black students attain less well than white students, those without traditional entry qualifications do less well than those that do, POLAR5 does better than POLAR1. And so on.
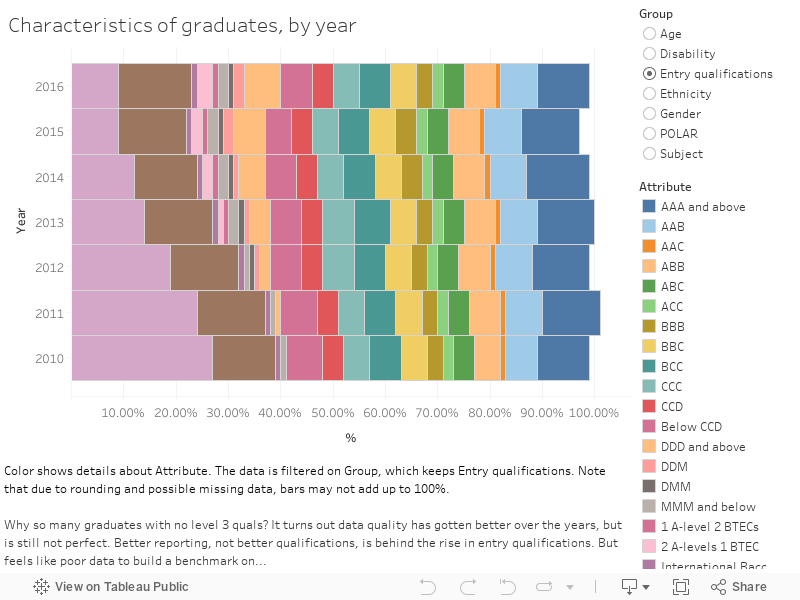
Here’s what the raw data looks like. Just to note on entry qualification, the OfS is suggesting that more than a quarter of all graduates in 2010-11 had no level 3 qualifications. Which, apart from anything else, suggests that it is not a good idea to build this data into the OfS reference model.
Counterintuitively, these demographic disadvantages are baked in to their model of what years beyond 2010-11 should have looked like. OfS compares this with the following years, with the percentage point difference between the number of observed and expected first plotted as “unexplained” first class honours degrees for each year.
So, an institution that recruits disproportionately well among young black people and works hard to raise attainment, will see a large “unexplained” increase in first class honours. Despite this, OfS is threatening to use the full range of its regulatory powers against providers that fail to address unexplained grade inflation.
Nice try, but try again
This bluntly is what happens when the OfS relies on data rather than contextual evidence. For me, the best approach to unexplained results is to ask institutions to explain them. I’m sure there are a number of great reasons – reasons that should be celebrated – that attainment has improved. I’m sure that many first class graduates and their employers would be happy to chip in. Maybe some current students could add information on how hard they are working and how well they hope to do.
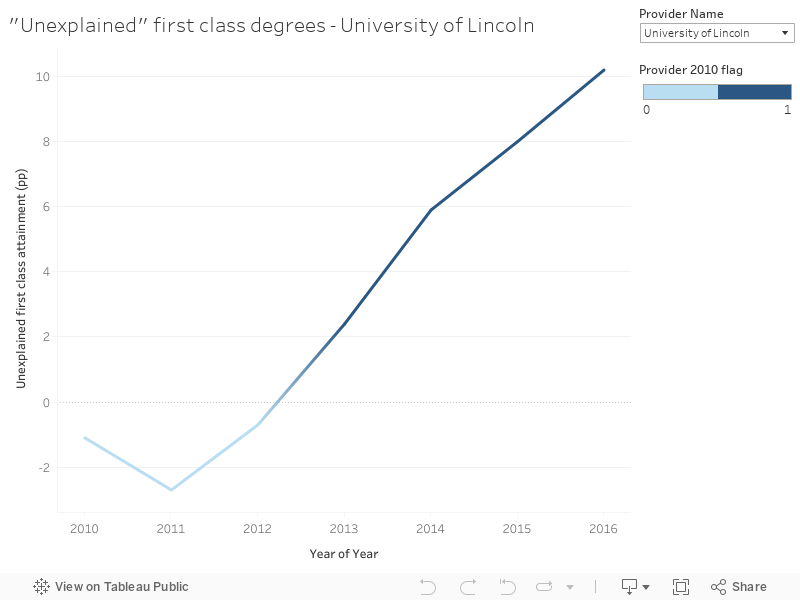
The other problem I have with this release is the decision to release institutional-level data. This seems engineered to get journalists to run it as a league table story. By the time you read this, I’m sure all the usual papers will be splashing with their “top 10 institutions awarding too many first class degrees” pieces – without any accompanying notes on how this is assuming a natural order where poor kids do worse than rich ones, and white kids better than black ones. You’ll excuse me for not playing that game here. You can see individual results below, and if you want a league table please feel free to build your own.
The thing is there is very likely some grade inflation in the system. Institutions are under a lot of pressure to perform better partly to meet performance targets and partly because some supremely idiotic league tables include number of first class degrees in their rankings. For me, the requirement to publish degree classification requirements at the start of each course, and to commit not to change these for that cohort, would do much more to address the legitimate issue without dragging the sector through the mire for no good reason.


Thank you for this helpful analysis.
This is a particularly interesting point “So, an institution that recruits disproportionately well among young black people and works hard to raise attainment, will see a large “unexplained” increase in first class honours. Despite this, OfS is threatening to use the full range of its regulatory powers against providers that fail to address unexplained grade inflation.”
The OfS appears to be setting up two competing and contradictory aims here – one being to preserve the status quo and avoid ‘grade inflation’ the other, through their new approach to Access and Participation plans published last week * being to set ambitious targets to eliminate gaps in degree outcomes between white & black students, and between disabled and non-disabled students.
In both cases there is a threat of OfS sanctions for institutions that don’t comply. It would be helpful if the OfS could clarify how their apparently competing objectives will be reconciled.
* https://www.officeforstudents.org.uk/news-blog-and-events/press-and-media/office-for-students-universities-must-eliminate-equality-gaps/
Great article, but it would be nice to see qualitative studies to discover what the real details are on increased equality of outcome as regards race. If we’re genuinely on the right track towards achieving this, greeting such achievement based on criticism of grade inflation seems like punishing attainment, or perverse incentive, to give it a slightly more old-fashioned name.
Another point to wonder about — when we disregard the anticipated reaction of those looking to maintain an elevation within a perceived heirachy, which is oft supposed to be the demographic for such articles — is: can we measure any of the “unexplained” grade inflation in terms of financial or cultural outcomes? If not then the suggestion of grade inflation could be a result of better education, or self-aggrandizing education, or neither. It will be interesting to see what the OfS is able to show in this regard as it might help them to further understand the student experience that marries statistical data with multivariate lived experience in a manner that benefits the fullness of society.
In other words: I largely agree with you.
@ Fiona Loughran, OfS won’t be able to give you clarification because it is a top-heavy Goliath.
In contrast, David Allen was a model of clarity: analysis, diagnosis, prescription – its all here: https://wonkhe.com/blogs/uk-degree-algorithms-the-nuts-and-bolts-of-grade-inflation/
A veritable stone in a sling that hits the mark.
This is a great article, but it’s unfair to criticise league tables for publishing the number of firsts etc. It’s very reasonable for a prospective student to want a better idea of what grade they’re likely to get (and for a league to provide this). I can’t help but feel that the real culprit is how weak the external examiner system is in the UK.
I disagree. As an institution has control over the number of firsts it offers, data on the number of firsts measures nothing of value. Just because information is possible to gather it does not mean that it is useful for understanding the quality of an institution.
David is absolutely right here. There is no value to publishing the number of firsts in league tables. The main effect of this information being public is the creation of a strong incentive on institutions to inflate grades in order to bump themselves up the league tables. As the UUK/GuildHE/QAA report said last month:
“The government, or more specifically government policy on performance monitoring, and the use to which the resultant league tables are put, could also have a perverse impact on grading and hence grade inflation and standards. It may be the case that upper degree outcomes should be removed from league table rankings altogether, but this would most likely be met with objection in a ‘consumerised’ higher education system where student
information is central.”
If we do not tackle the perverse market incentives on institutions then we will not address some of the key underlying causes. Instead, we risk disincentivising institutions from doing the things they should be doing, improving attainment, widening participation, and delivering better graduate prospects. What matters more to policymakers: their commitment to market ideology, or a high-quality, self-improving higher education system?
Absolutely spot on. OfS is operating straight out of the managerial textbook. Always ensure when setting targets that there is some measure which can be capriciously deployed to ensure the preferred result is achieved.
I’m sorry but I really don’t see how some of your indignation is justified here.
Sure, 2010/11 is an imperfect comparator year in some way we don’t know – but you don’t identify a particular reason it’s worse than any other, and given it was the year tuition fees changed it isn’t illogical to use it as a baseline.
Then you go on to complain that the data basically isn’t giving enough credit to institutions who recruit from non traditional backgrounds and then teach them really well. But where’s your evidence that this explains the gap? You seem to assume, without justification, that universities taking students with weak A levels have found a secret sauce that suddenly dials their attainment up from middling (say thirtieth percentile at A level) to outstanding. Why does that seem more likely than those universities just bunging a few more firsts through to justify their fees?
I accept that students may be working harder than when courses were cheaper; and equally that there may be more focus on quality teaching etc. But there is no way that explains what’s happening here in full, and institutions awarding firsts to 50 percent of their students are going to bring the whole thing crashing down.
If you are controlling by A level result it would make sense to chose a year when you knew what the majority of graduates got in their A levels. Tuition fees changed in 2012-13, but as we are talking about graduates it would make no difference in these figures till 2014-15.
And teaching students so they do better than you would otherwise expect is pretty much what universities have done since the 9th century. If you can predict their grades by what they come in with why bother teaching at all?
Nothing explains the rise of first class degree numbers in full – but suggesting (as OfS do) that the entirety of the rise is problematic is surely unhelpful at best.
Great article, as someone who supplies this data for our institution I would say it is risky using any data prior to a few years ago. The TEF was largely conceptual for a number of years before it was introduced but seems to have no problem using data that was collected for other purposes. I think you are right to question the quality of most of the underlying data. Our institution has to put in significant work to accurately capture Qualifications On Entry. UCAS have their version, a second version appears when students arrive, and there are specific groups that do not go through the UCAS system. The focus for many years has been on Tariff-bearing students, which only includes those 21 and below. As a result there is a large portion of “Highest Qualification On Entry” that is an assessment made by one administrator viewing thousands of entrants, with very poor guidance from HESA or OfS.
These statistics also ignore a few obvious influences that would skew the data. Firstly, I doubt it’s a coincidence that grade inflation seems to have occurred since the introduction of £9,000 fees and the not so subtle message that HEIs must act like corporate competitors in a free market. Secondly, there is something inherently wrong with using a measure that applies constant pressure on academics and HEIs to improve but with a expectation that it never should, and the proportion should remain static? You can’t ask for improvement, receive it, and then call it unexplained grade inflation.