


The most striking insight to come out of the Higher Education Statistics Agency’s (HESA) first release of detailed ethnicity breakdowns is a notable divergence in trends within broad ethnic groups.
This raises the question of how reliable it is to make policy decisions based around improving outcomes for different ethnic groups based on these broad categories.
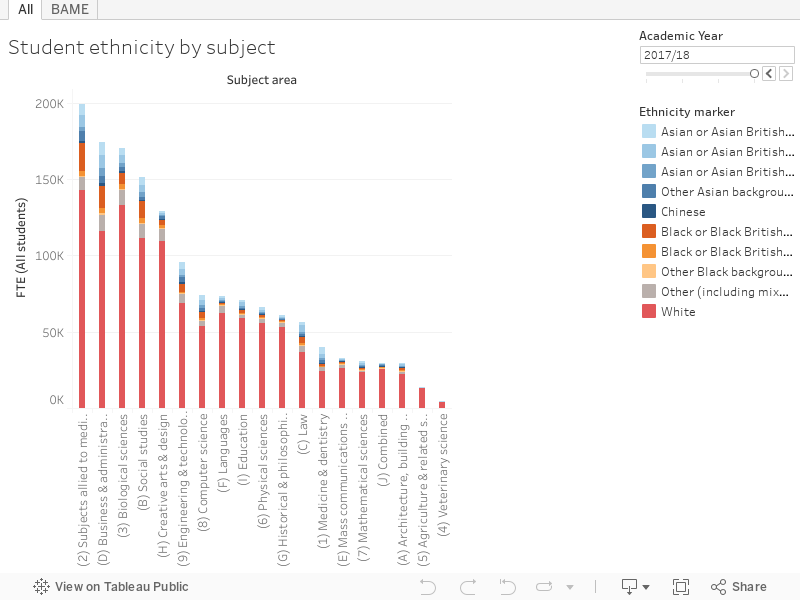
UCAS subject data for the 2017/18 admissions cycle suggested that, at a UK level, business subjects continue to grow, and there has been a small uptick in the student population for both biosciences and subjects allied to medicine. This latter group is made up primarily of nursing students, and secondarily students of pharmacy.
When using HESA data to look at the numbers of students on each course, however, the most common subject group among all students in 2018 was subjects allied to medicine. But when you look at students from minority ethnic backgrounds in isolation, business and administrative studies becomes the most popular course with subjects allied to medicine second.
Into the detail
[Full screen]
The proportions of African and Caribbean students that make up total numbers of black students in higher education – 108,560 in the last full academic year – have remained broadly static over the last five years, with African students making up 74% of the total number of black students in 2018, and Caribbean students accounting for 21%. African students make up a larger proportion of total black students in higher education than they do in the general population – as of the 2011 census, the Black population of England and Wales was made up of 57% people of African background and 28% Caribbean, with the remaining proportion made up of those of “Other” (often non-specified) black background.
There was some noticeable divergence in subject trends between the two groups: half of African students studied science-related subjects in the academic year ending 2018, compared with 40% of Caribbean students. The split between numbers studying science related and non-science related subjects is otherwise (very) roughly an even split among all broad ethnic groups, though Indian students were slightly more likely than Pakistani students to enter science-related subjects.
Indian students in medicine
One stark variation within ethnic groups is the likelihood of Indian students to study medicine or dentistry, compared with any other ethnic subdivision. Almost one in ten (9.5%) of Indian students in 2017/18 studied medicine or dentistry, compared with 5% of Pakistani students, and 2% of white students (the next two groups in order of the proportion of students on these two courses).
In comparison, Pakistani and Bangladeshi students were much more likely to study subjects allied to medicine, at 15% and 11% of the total for both groups, respectively. The highest proportion is found among African students at just under a quarter (23%) of the total.
Another popular subject among Pakistani students was Law, with 8% of Pakistani students enrolled onto a Law course in 2017/18. Thirteen percent of Black African students studied Law in 2017/18, compared with 5.5% of Caribbean students in the same year. At a glance, there are more similarities in the most popular subjects among African students and Pakistani students than there are between African and Caribbean students.
The Office for Students’ latest guidance for providers identifies examples of effective work being done at providers to target the needs of ethnic minority students but it finds that universities do not target ethnic groups in this way because they have concerns about the stigma surrounding such targeted, positive action and in some cases even worry that it is illegal.
This small sample of divergent trends within broad ethnic groups highlights the need to look at the communities that make up these broad categories more closely and question what factors – be it cultural differences, community makeup, or other trends – are behind the differences in student demographics within the sector. Simply complaining about the proportion of broad ethnic groups in HE is important, but it is the detail that will help us address the problem.


Another huge issue in tackling access gaps by ethnicity at the most selective universities is the targeting of effort and resources on POLAR Q1 wards, both in terms of the targets set by universities in their Access and Participation Plans,and in terms of national OfS KPM targets and OfS-funded spending like NCOP.
Those from ethnic minorities are only half as likely to live in POLAR Q1 as white students, with some ethnicities being only a third as likely.
A similar argument could be made about socio-economically disadvantaged young people. Time to move away from an area measure like POLAR and start using individual level characteristics
When the report uses the term ‘African’ students – I presume they mean students of African descent. Do we presume that all ‘Caribbean’ heritage students are also of African descent? Please clarify which ethnicity represents ‘Caribbean’