


The headline numbers from this year’s graduate outcomes data – which represents the activities and experiences of the cohort that graduated in 2022-23 around 15 months after graduation look, on the face of it, disappointing.
There’s a bunch of things to bear in mind before we join the chorus claiming to perceive the end of graduate employment as a benefit of higher education due to some mixture (dilute to preference) of generative AI, the skills revolution, and wokeness.
We are coming off an exceptional year both for graduate numbers and graduate recruitment – as the pandemic shock dissipates numbers will be returning to normal: viewed in isolation this looks like failure. It isn’t.
But we’ve something even more fundamental to think about first.
Before we start
We’re currently living in a world in which HESA’s Graduate Outcomes data represents the UK’s only comprehensive official statistics dealing with employment.
If you’ve not been following the travails of the ONS Labour Force Survey (the July overview is just out) large parts of the reported results are currently designated “official statistics in development” and thus not really usable for policy purposes – the response rate is currently around 20 per cent after some very hard work by the transformation team, having been hovering in the mid-teens for a good while.
Because this is Wonkhe we’re going to do things properly and start with looking at response rates and sample quality for Graduate Outcomes, so strap in. We’ll get to graduate activities in a bit. But this stuff is important.
Response rates and sample quality
Declining survey response rates are a huge problem all over the place – and one that should concern anyone who uses survey data to make policy or support the delivery of services. If you are reading or drawing any actionable conclusions from a survey you should have the response rate and sample quality front and centre.
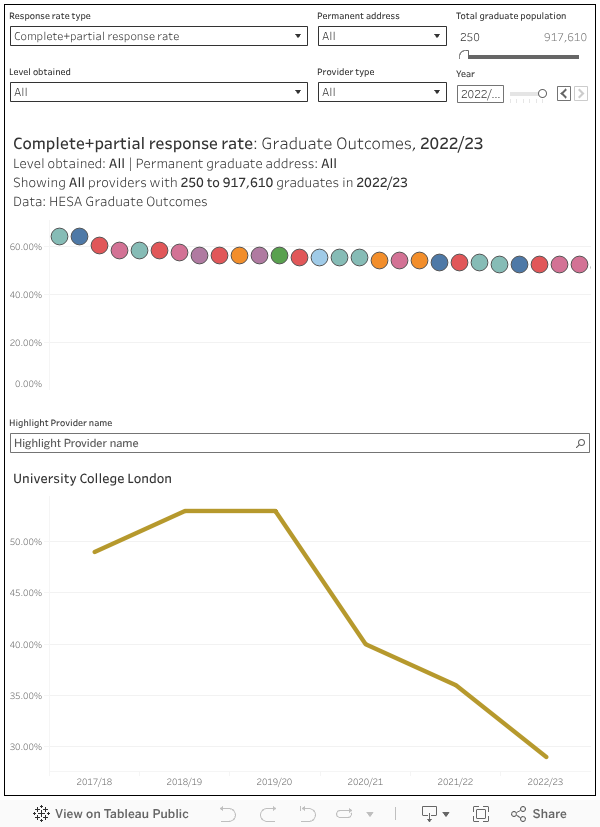
The overall completion rate for the 2022-23 cohort for Graduate Outcomes was 35 per cent, which you can bump up to 39 per cent if you include partial completions (when someone started on the form but gave up half-way through). This is down substantially from 48 per cent fully completing in 2019-20, 43 per cent in 2020-21, and 40 per cent in 2021-22.
There’s a lot of variation underneath that: but provider, level of previous study (undergraduate responses are stronger than postgraduate responses), and permanent address all have an impact. If you are wondering about sampling errors (and you’d be right to be at these response rates!) work done by HESA and others assures us that there has been no evidence of a problem outside of very small sub-samples.
Here’s a plot of the provider level variation. I’ve included a filter to let you remove very small providers from the view based on the number of graduates for the year in question – by default you see nothing with less than 250 graduates.
What do graduates do?
As above, the headlines are slightly disappointing – 88 per cent of graduates from 2022-23 who responded to the survey reported that they were in work or further study, a single percentage point drop on last year. The 59 per cent in full-time employment is down from 61 per cent last year, while the proportion in unemployment is up a percentage point.
However, if you believe that (on top of the general economic malaise) that generative AI is rendering entry level graduate jobs obsolete (a theme I will return to) you will be pleasantly surprised by how well employment is holding up. The graduate job market is difficult, but there is no evidence that it is out of the ordinary for this part of the economic cycle. Indeed, as Charlie Ball notes, we don’t see the counter-cyclical growth in further study that would suggest a full-blown downturn.
There are factors that influence graduate activities – and we see a huge variation by provider. I’ve also included a filter here to let you investigate the impact of age: older graduates (particularly those who studied at a postgraduate level) are more likely to return to previous employment, which flatters the numbers for those who recruit more mature students.
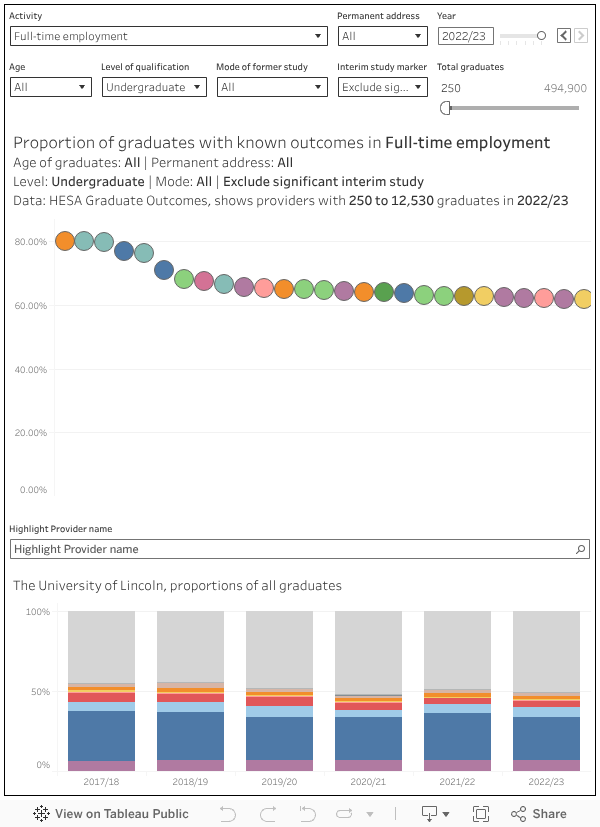
One thing to note in this chart is that the bar graph at the bottom shows proportions of all graduates, not the proportions of graduates with known destinations as we see at the top. I’ve done this to help put these results into context: though the sample may be representative it is not (as is frequently suggested) really a population level finding. The huge grey box at the top of each bar represents graduates that have not completed the survey.
A lot of the time we focus on graduates in full-time employment and/or further study – this alternative plot looks at this by provider and subject. It’s genuinely fascinating: if you or someone you know is thinking about undergraduate law with a view to progressing a career there are some big surprises!
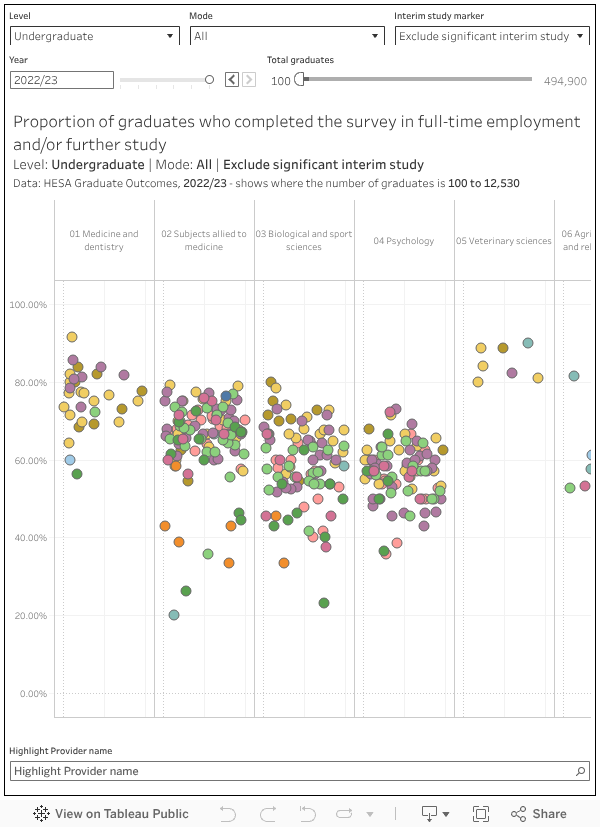
Again, this chart shows the proportion of graduates with a known destination (ie those who responded to the Graduate Outcomes survey in some way), while the size filter refers to the total number of graduates.
Industrial patterns
There’s been a year-on-year decline in the proportion of graduates from UG courses in paid employment in professional services – that is the destination of just 11.92 per cent of them this year, the lowest on record. Industries that have seen growth include public administration, wholesale and retail, and health and social care.
There’s been a two percentage point drop in the proportion of PG level graduates working in education – a lot of this could realistically put down to higher education providers recruiting fewer early-career staff. This is a huge concern, as it means a lot of very capable potential academics are not getting the first jobs they need to keep them in the sector.
And if you’ve an eye on the impact of generative AI on early career employment, you’d be advised to keep an eye on the information and communication sector – currently machine generated slop is somehow deemed acceptable for many industrial applications (and indeed employment applications themselves, a whole other can of worms: AI has wrecked the usual application processes of most large graduate employers) in PR, media, and journalism. The proportion of recent undergraduates in paid employment in the sector has fallen from nearly 8 per cent in 2020-21 to just 4.86 per cent over the last two years. Again, this should be of national concern – the UK punches well above its weight in these sectors, and if we are not bringing in talented new professionals to gain experience and enhance profiles then we will lose that edge.
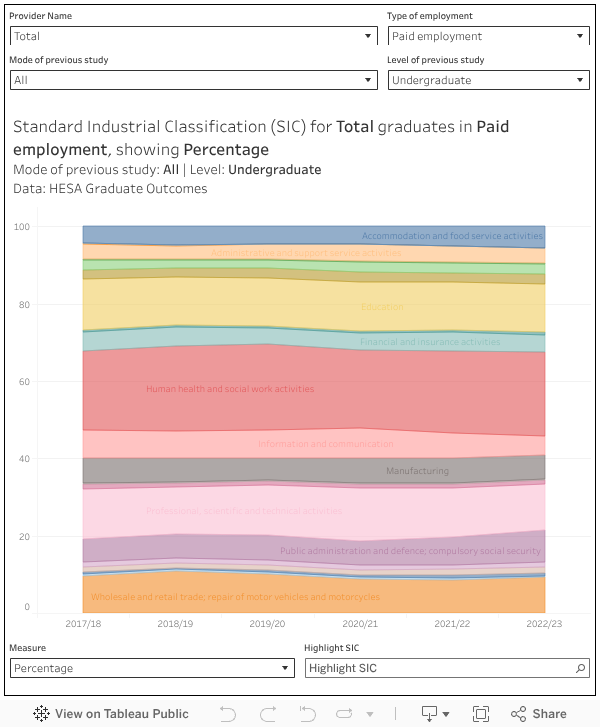
To be clear, there is limited evidence that AI is taking anyone’s jobs, and you would be advised to take the rather breathless media coverage with a very large pinch of salt.
Under occupation
Providers in England will have an eye on the proportion of those in employment in the top three SOC codes, as this is a key part of the Office for Students progression measure. Here’s a handy chart to get you started with that, showing by default providers with 250 or more graduates in employment, and sorted by the proportion in the top three SOC categories (broadly managers and directors, professionals, and associate professionals).
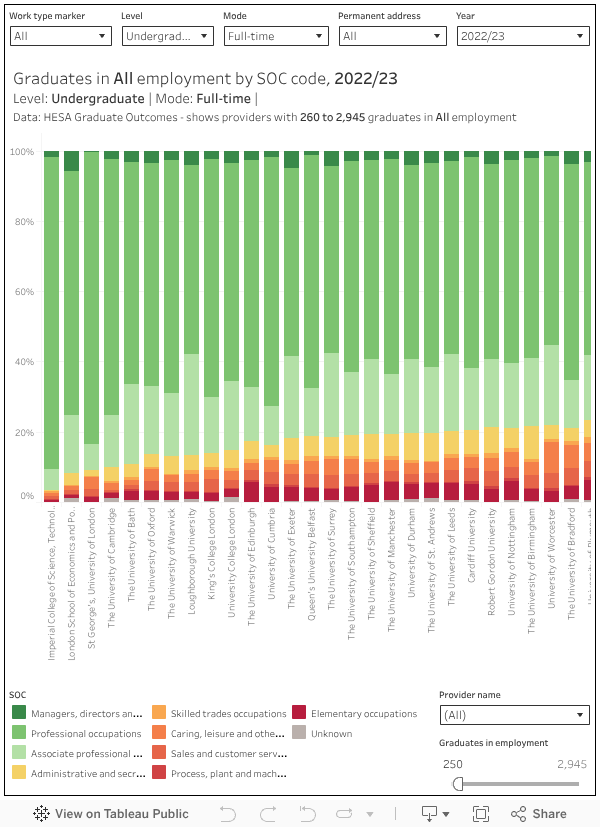
This is not a direct proxy for a “graduate job”, but it seems to be what the government and sector have defaulted to using instead of getting into the weeds of job descriptions. Again, you can see huge differences across the sector – but do remember subject mix and the likely areas in which graduates are working (along with the pre-existing social capital of said graduates) will have an impact on this. Maybe one day OfS will control for these factors in regulatory measures – we can but hope.
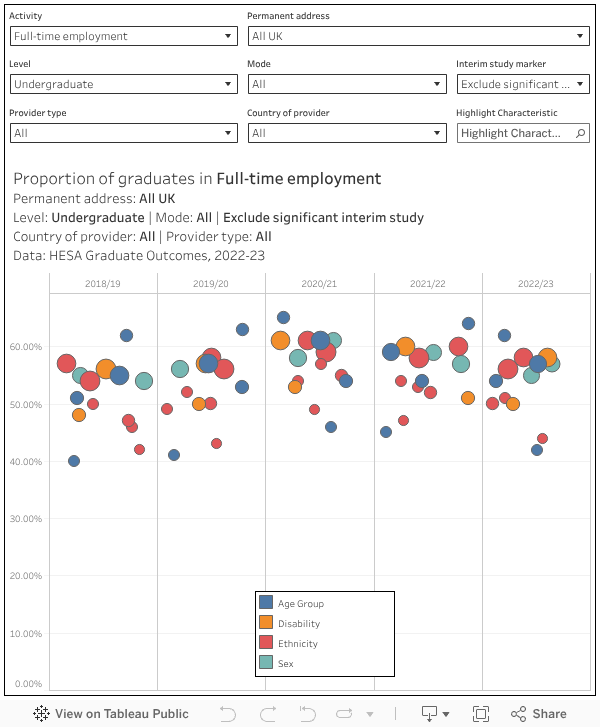
Here’s a plot of how a bunch of other personal characteristics (age of graduates, ethnicity, disability, sex) can affect graduate activities, alongside information on deprivation, parental education, and socio-economic class for undergraduates. The idea of higher education somehow levelling out structural inequalities in the employment market completely was a fashionable stick to beat the sector with under the last government.

Everything else
That’s a lot of charts and a lot of information to scratch the surface of what’s in the updated graduate outcomes tables. I had hoped to see the HESA “quality of work” measure join the collection – maybe next year – so I will do a proxy version of that at some point over the summer. There’s also data on wellbeing which looks interesting, and a bunch of stuff on salaries which really doesn’t (even though it is better than LEO in that it reflects salaries rather than the more nebulous “earnings”) There’s information on the impact of degree classifications on activity, and more detail around the impact of subjects.
Look out for more – but do bear in mind the caveats above.


To clarify. Nobody should be wondering about sampling error in the Graduate Outcomes survey. This is a census survey, it does not use sampling and therefore is not subject to sampling error. I believe the author confused it with non-response error. We should always wonder about the non-response error, regardless of the response rates.