


The Social Mobility Commission’s “Moving on to move up” report was an underappreciated gem for higher education policy fans. And the new report – “The long shadow of deprivation”, should also be an essential read for wonk-kind.
Both reports take old geographic inequality assumptions and retool them with data for 2020. “Moving on…” demonstrated how, for some young people, moving out of the place they were born is the only way to move on in their lives, and now “The long shadow…” demonstrates that, even if they do move on, their formative experiences still have a bearing on their future earnings.
LEO, but for good
If you’ve been following the largely interminable debate on the “value of higher education” over the last few years you will have spotted a recent shift. We have moved away from graduate salaries as an indicator of the “value” of a particular course or provider, and have returned to ideas around a “quality education” – using graduate highly skilled employment, and non-continuation rates as proxies. This has happened, it appears, because officials are becoming increasingly acquainted with the limitations of LEO specifically and salary data more generally. There is a link between salary and subject area or provider, but other factors have a large enough impact on salary to make this difficult to use.
The SMC are using LEO data here, in possibly the most sensible application of the much-maligned dataset I have seen. Rather than focus on salaries (though these are available in the data), the focus is on the impact education has on pay, through a regional and deprivational (the free school meals indicator) lens. Most applications of LEO have used a HE provider or subject of study focus, and many of us have felt that this elides more important variations. The restrictions remain – we are only using data for men (or “sons”, as the report dubs them) because women are more likely to work part time and LEO can’t deal with part time pay rates.
Educational and earnings inequality
In an equitable world, not only would everyone have access to education but this education would have a similar benefit to their earnings. We would be able to offer a genuinely national calculation of the lifetime earnings benefit for anyone considering higher level study. We can’t do this for two reasons neatly set out here:
- The level of deprivation you experienced growing up (here indicated using the free school meals measure) has an impact on your future salary.
- The place that you grew up in also has an impact.
Where this gets complex is that these variables interact – young people with the FSM marker tend to earn less, and in some areas you are more likely to have experienced free school meals. Young people with FSM are also less likely to access higher education.
So what the SMC have done is to rank local areas in England by quintile for both pay (comparative average earnings – so the percentage difference between what young men with most and least deprived incomes would earn) and education (difference in test performance at age 16 between the most and least deprived young men) for young men who entered university between 2002 and 2009. And then, they have ranked areas by the amount of impact a higher level of education appears to have on earnings – showing the underlying impact of place on earnings.
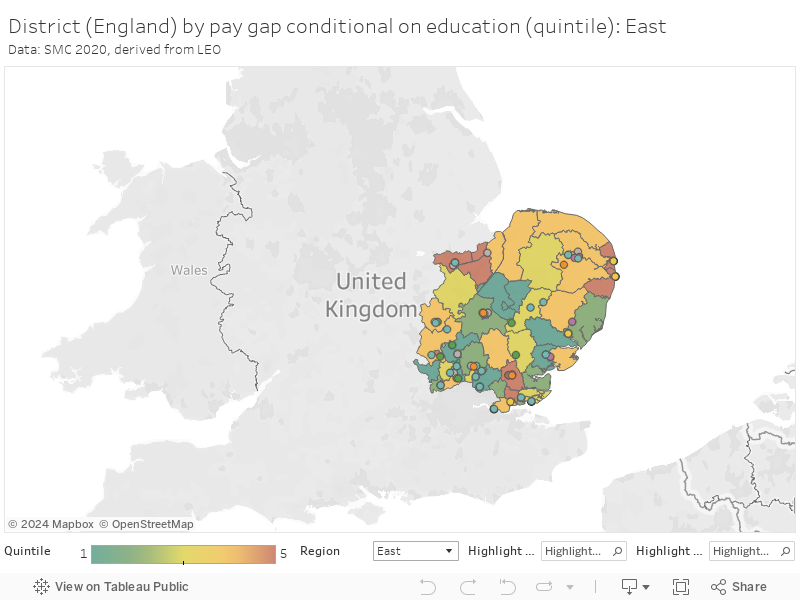
[Full screen, and here is a table for those who prefer it]
On the map, the colours correspond to the quintile of average earnings, conditional on education, in each area (you can use the highlighters and region filters to find the lower tier local authority [LTLA18] area you are interested in). So, areas where underlying deprivation has a large impact on the ability of education to raise salaries are marked in red, areas where underlying deprivation does not have as strong an impact are marked in green).
Another view
SMC notes that in areas of low social mobility, it is far harder for someone from a deprived background to escape deprivation via education. Up to 33 per cent of the pay gap is driven by non-educational factors at the end of quintile 5.
It’s a little bit complex to comprehend a derived measure like this, so I made you a scatter graph.
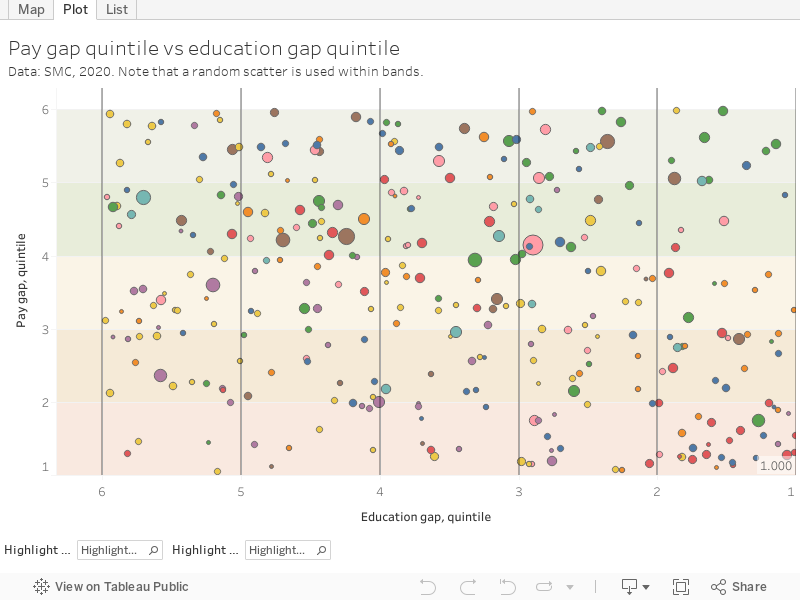
We have the pay quintiles along the side (marked with coloured bands) and the education quintiles along the bottom. Each area is marked with a blob – size relates to the number of young men in the data, and I’ve used a random scatter to make the blobs not sit on top of each other.
So a place at the top right of this graph, like Stockton-on-Tees, education-driven social mobility is low, and pay gaps are high. And a place at the bottom left, like Oxford, education-driven social mobility is high and pay gaps are small. At the top left, somewhere like Thanet, sees low education-driven social mobility, but a lower pay gap. And so on.
Recommendations for policymakers
To equalise opportunities for those from the most and least deprived backgrounds, driving up education quality and continuing to close the attainment gap will be crucial. But to ‘level up’ between places, these actions need to be supplemented with wider-ranging policy interventions primarily to enable better labour market participation and access.”
In essence – there’s two ways to do social mobility. You can give individual disadvantaged people opportunities to succeed (primarily through education) – but the drawback is they generally have to move away from where they live to take these opportunities. Or you can work on “levelling up” a disadvantaged region by offering better labour market access, salaries, and skills support – but the downside here is that individual young people may not achieve their own ambitions.
People like David Goodhart have spent years arguing for levelling up places rather than people, putting them – until recently – at odds with the main thrust of social mobility policy, which has been focused on widening participation in higher education. The Johnson administration has made a lot of noise on the Goodheart side of the equation – admittedly, partially for electoral benefits.
But it doesn’t have to be a simple opposition. As the report says:
Education gaps account for most of the pay gaps in all areas, and reducing these is important in and of itself. However, we also need to look at equalising labour market opportunities available for young people with the same education level as those from richer backgrounds if we are to ‘level up’ between places”
We need, in short, to do both.


