A data interpretation quiz for you all – if I said the “sector percentage” of 2019-20 full time first degree undergraduate students in receipt of the disabled student allowance was seven per cent, would you take this to mean:
- Seven percent of providers had 2019-20 full time first degree undergraduate students in receipt of DSA?
- Seven percent of 2019-20 full time first degree undergraduate students in UK higher education are in receipt of DSA?
It’s the first one, isn’t it? For reference 92 per cent of providers had 2019-20 full time first degree undergraduate students in receipt of DSA.
Data and storytelling
Both figures are useful, but each sends a different message. When you read 92 per cent you mentally parse that as “more than 9 in 10” or “pretty much everyone”. If I was writing about the need for all providers to offer suitable support to students with specific needs, I might use 92 per cent to push home the point that this also means you.
On the other hand, I might use seven per cent to highlight the low number of students claiming DSA. Nine per cent parses as “one in ten” or “a small but significant group” – if I was writing about students not claiming DSA when they would be eligible for it and could benefit from it I would say that a surprisingly low seven per cent of students currently claim it, comparing it to the fact that 32 per cent of secondary school students have special educational needs or disabilities.
Chilling effect
I use a serious issue to make light of a silly one. According to a new Office for Students report, the English “sector percentage” of “events/speaker requests rejected” in higher education settings has been six per cent for each of the last three years. Yes, that’s incidents (a “non-zero value” on the return) at six per cent of the English providers who responded to the question.
In the rational world where that is not what “sector percentage” means, the figures are 0.09 per cent of all events in 2017-18, 0.23 per cent in 2018-19, and 0.21 per cent in 2019-20. The problem with these figures (accurately reported by registered providers in compliance with regulatory framework condition F3).
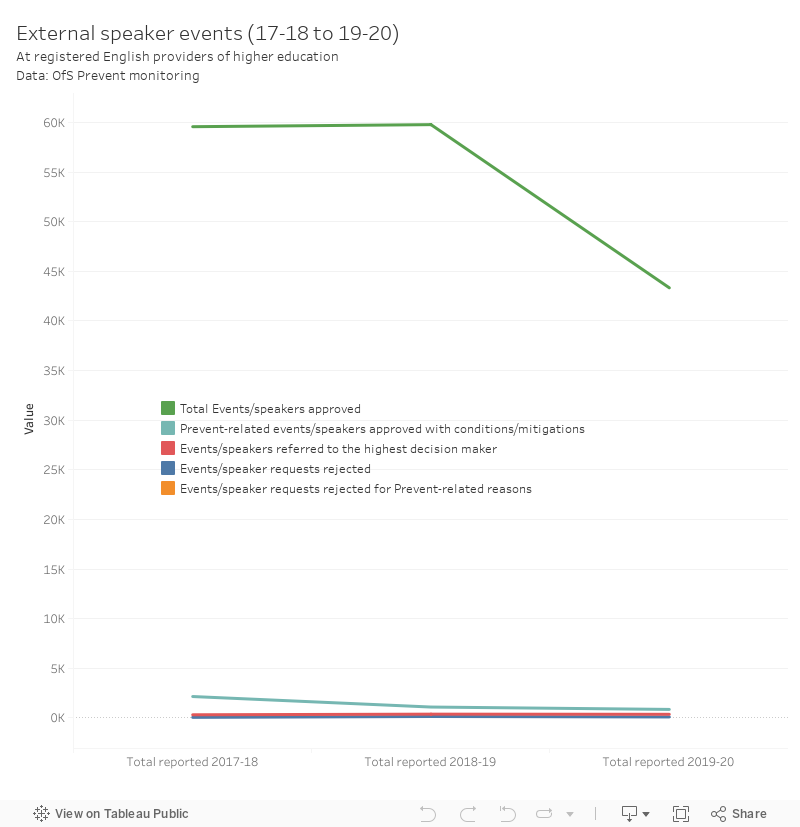
If you’re wondering about the dip in events in 2019-20 – that would be the “chilling effect” of a global pandemic.
Now, I’m all for alternative measures, provided definitions are clear and widely understood. But it is not difficult to imagine one of the less statistically literate participants in forthcoming debates on the Freedom of Speech (Higher Education) Bill claiming that six per cent of events are cancelled. This would be incorrect, and would distort the reported facts. It makes it look like the problem is much larger than it actually is.
Ninety-nine point eight per cent
Providers registered with the OfS are required to submit this data as a component of an “Accountability and Data Return”. The guidance notes that data needs to be submitted on all external speaker and event applications approved through the external speaker’s process. There’s information to be provided on mitigations (relating to Prevent and, mysteriously, “freedom of speech”) and reasons for rejection, the latter backed by explanations of Prevent-related decisions. We know that fewer than five, in total, events were rejected for Prevent-related reasons across 2018-19 and 2019-20.
On the face of it, that could be read as suggesting that decisions regarding all the other rejected events (a total of somewhere between 230 and 235 over the two years) were made in denial of the right to free speech. But these rejected events would also include those where the decision was made in light of an assessment of risk (it’s probably not a good idea to have a convicted fraudster talk to to the enterprise society about their latest pyramid scheme) or a problem with the process (the logistics of having Jeremy Corbyn speak on campus can’t really be managed if you only know about it the morning of the proposed event).
The fact that 99.8 per cent of external speaker events go ahead (there I go again, selectively using statistics to illustrate a point) suggests to me that the system is working largely as planned. If 100 per cent of events went ahead, I’d be concerned about safeguarding. It demonstrates that the vast majority of external speakers (a barrister talking to LawSoc, a visiting preacher at the Islamic Society, Timmy Mallett at the 80s TV Society…) are uncontroversial.
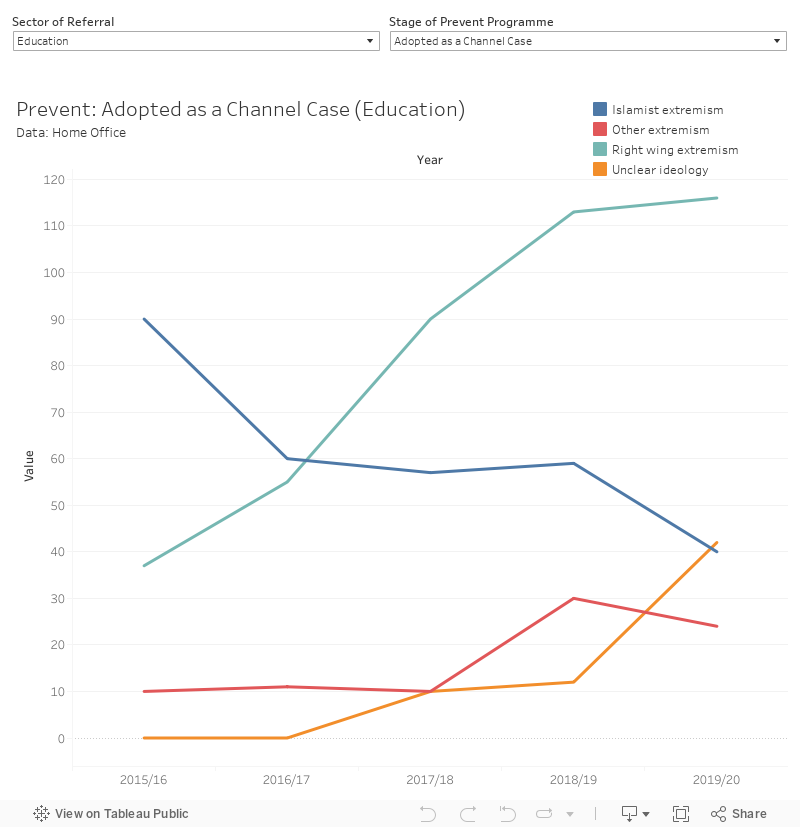
Extremism
And here’s another statistic for you all – the government collects and publishes data on Prevent referrals, and although we don’t get these broken down beyond very broad categories we can see some interesting trends regarding the types of concern that turn into actual cases from education settings. Right-wing extremism is a growing problem in education. I await the inevitable legislation to deal with this.