


Gather round people, because I’m going to say something nice about Teaching Excellence and Student Outcomes Framework (TEF). The underlying data is one of the best sources of information about the impact of ethnicity on the student experience, and the graduate job market, that we have.
It is not a trivial task to get data broken down by institution and ethnicity for the Destination of Leavers in Higher Education (DLHE) survey, or from the National Student Survey (NSS). And there is nothing in the main Longitudinal Educational Outcomes (LEO) releases either. The implication is that such analysis should only be done by researchers (with the approval of the data holders), or within institutions via the HEIDI plus service.
The issues raised in the recent Student Academic Experience Survey suggested some interesting patterns in experience by ethnicity, all of which made me want to dive in to some sector-wide data to investigate further.
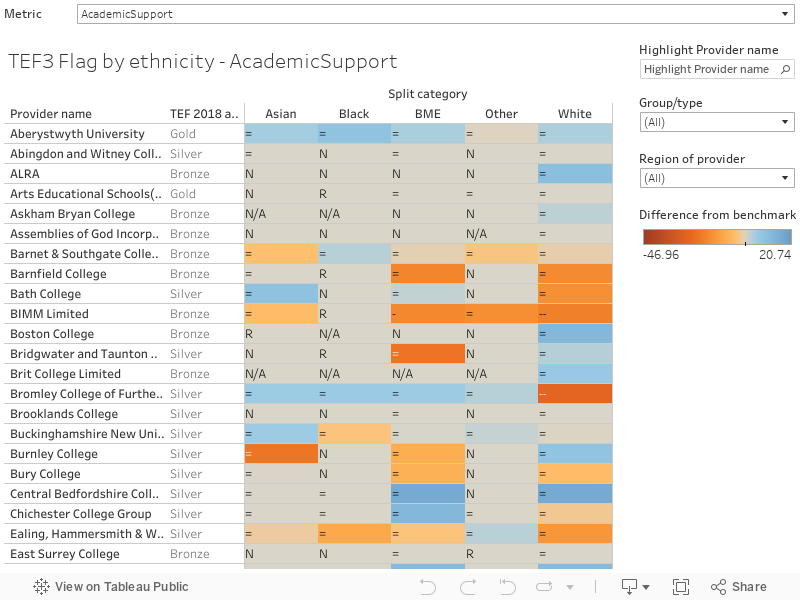
So what I have done here is simply to present the significance flags for each ethnicity split, by institution, for each metric. Bear in mind that the significance flag indicates the way in which each data point deviates from the benchmark – ethnicity is taken account of within the core benchmark, but the values here are compared against a benchmark that comprises students of that ethnicity.
The TEF3 data also includes LEO data on sustained employment/further study, and earnings above the median, even though LEO is a “supplementary metric”, not a core metric. Astute observers will recall that the other TEF3 supplementary metric – on “grade inflation” – was deemed too explosive either to provide splits for, or actually publish on a spreadsheet.
Ethnicity being in the core benchmarks suggests that it is believed such attributes of the student body (and the differences linked to those attributes) are not wholly in the institution’s control, but do affect performance. This deserves unpacking to be absolutely clear – TEF runs on the basis that ethnicity does have a material impact on student experience, student continuation, and graduate destinations… but that institutional performance can be measured by difference in performance from the appropriate benchmark.
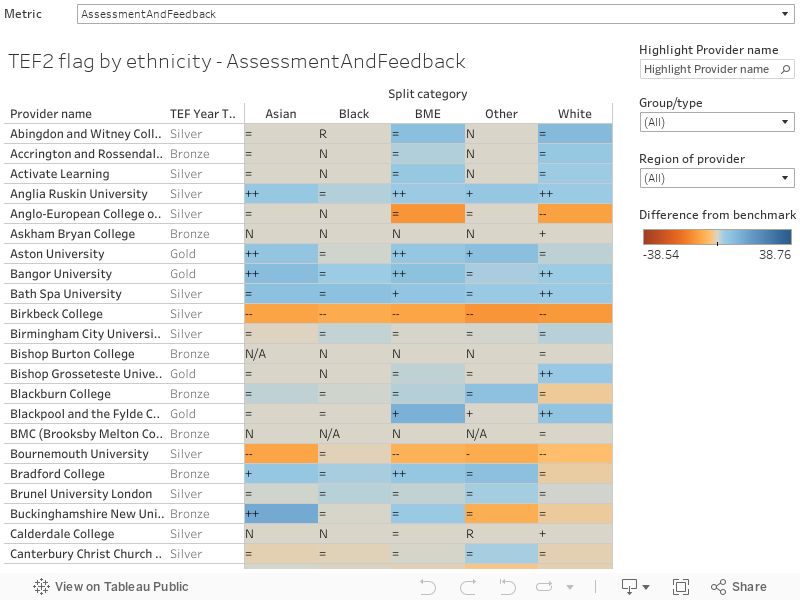
For the TEF3 and TEF2 tables below, select the metric you are interested in – the flag is shown for each institution for each split, with the colour of the cell relating to the difference between the institutional metric value and the benchmark. You can filter and highlight institutions in the usual way.
TEF3 data
TEF2 data
More fun with benchmarks
Benchmarking is one of the least discussed, but most interesting. parts of TEF. It draws on the benchmarks developed for sector performance indicators by HESA – here is a link to a page that explains how they are derived.
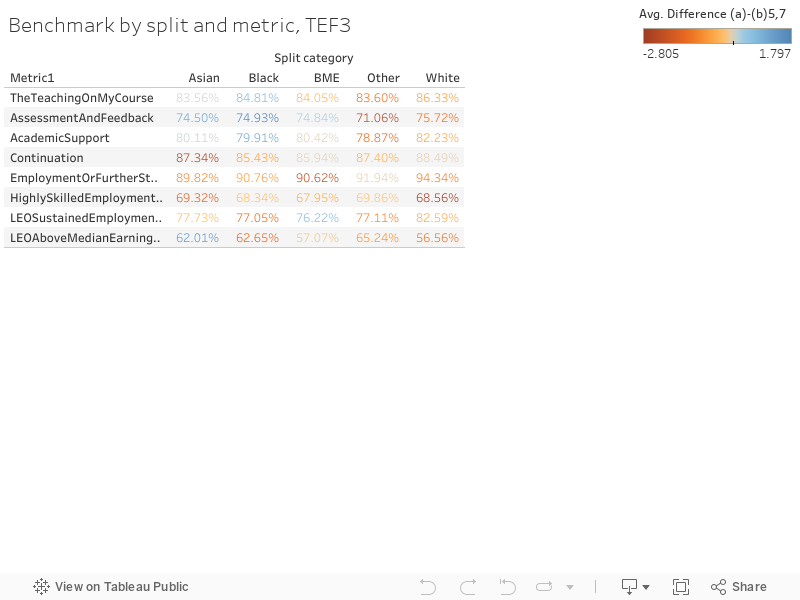
I’m sure that doing so will immensely annoy statisticians, but it is possible to calculate an average benchmark by split for each TEF exercise. So, I have. What this shows is the different expectations – on average – that we have for the satisfaction, continuation, and graduate experience of students from different ethnic backgrounds.
Because benchmarks are calculated based on all eligible TEF institutions, rather than just those that have entered, I have only done this for the TEF3 data (the latest available). The big problem that this builds in is that the average benchmark values for all institutions will not be the same as the benchmark values for the self-selecting subset of institutions that entered TEF3.
I feel like we should bear the caveats in mind, but the table is interesting enough to share. It’s a peek behind the curtain rather than a proper examination – and the proportions are of more interest to us than the actual values (though for fun I’ve used the average difference between benchmark and actual scores as the colour). As far as I’ve been able to identify the benchmark values are not themselves published by ethnic background elsewhere.


“it is possible to calculate an average benchmark by split for each TEF exercise” — another way might be to work upwards from the sector averages they used for benchmarking, which are available at the intersections of all the splits. (https://www.officeforstudents.org.uk/media/33818d13-fd7a-4a97-a376-a66967db74df/tef-year-three_sector-averages_updated_17112017.xlsx).
This doesn’t give an overview (though you could mock up some average populations of BAME students at different types of provider and multiply it out); but the advantage is you can control for subject choice and other splits. Say, academic support for young physics UG master’s students:
Asian 2015 NSS 79.5%
Asian 2016 NSS 77.8%
Asian 2017 NSS 83.8%
Black 2015 NSS 66.7%
Black 2016 NSS 87.5%
Black 2017 NSS 60.3%
Other 2015 NSS 76.6%
Other 2016 NSS 83.8%
Other 2017 NSS 82.0%
White 2015 NSS 86.8%
White 2016 NSS 85.5%
White 2017 NSS 85.8%
That’s a good shout! Thanks Andy, had forgotten entirely about that dataset and will take a look.