


At a crucial time for the sector, a significant review of over 30,000 current students helps us understand what to stick with, what to ditch and what to return to as we move out of the pandemic.
For the last decade, Whatuni has been asking current students to review their higher education experience. What started off as an initiative to help inform prospective students about what and where to study has grown to over 30,000 student reviews annually – still helping to guide future students, but also becoming a valuable resource for providers to make changes and enhancements to their offer.
Of course, this is a significant time for the sector. Large numbers of students who rated their experience this year will have been affected by the pandemic at some point in their study, but with restrictions lifted, providers are at a crossroads about what it should look like going forward.
Steps forward, steps back
These reviews provide institutions locally, and policy makers nationally, with valuable information about the features of the remote experience students would like to retain, but also the features they are keen to see return to something akin to the pre-pandemic experience.
For the reviews collected in 2022 (largely through January to April this year) there are some striking results. Unlike other national surveys, these reviews incorporate all years of undergraduate and postgraduate study, offering a more comprehensive picture of satisfaction across the full spectrum of students.
Although Whatuni also collected reviews in 2021, we feel the most appropriate comparison is with the results published in 2020 (where on-campus fieldwork was completed just before universities closed for the pandemic in March) and some of our analysis seeks to show what the impact of the pandemic has been on students between then and now.
Looking over all
In the overall category, where students are invited to rate their experience as a whole, the average rating for students across UK providers was 4.08/5 which equates to 81.6 per cent. This is in comparison to 2020, where students gave an average rating of 4.20/5, equating to 84 per cent.
While the drop of -2.4 percentage points between the 2020 and 2022 results is of course disappointing, much of it is explained by the pandemic disruption. However, there are some areas when providers have been able to demonstrate an improvement.
| Category | 2020 | 2022 | Change |
|---|---|---|---|
| Overall (University of the Year) | 4.20 | 4.08 | -2.4pp |
| Student support | 4.01 | 3.80 | -5.2pp |
| Students' union | 3.82 | 3.70 | -3.1pp |
| Lecturers and teaching quality | 4.00 | 3.95 | -1.3pp |
| Career prospects | 4.03 | 4.00 | -0.6pp |
| Student life | 3.91 | ||
| Facilities | 4.11 | 4.17 | +1.5pp |
| Halls and accommodation | 3.81 | 3.91 | +2.6pp |
It is perhaps unsurprising that the category with the biggest dip in satisfaction between 2020 and 2022 is around student support (80.2 per cent in 2020 to 76 per cent in 2022).
Support
We know that student expectations of and demand for student support services has risen dramatically during the pandemic – at a time when provider budgets have been squeezed.
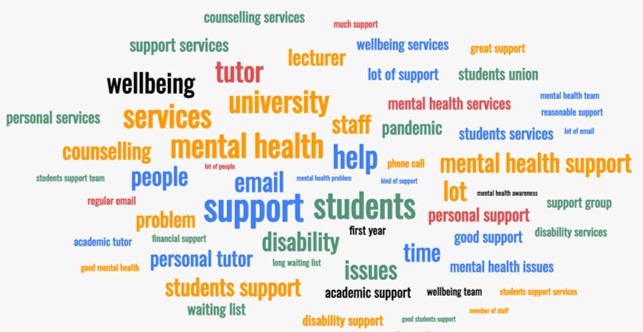
While many institutions are making more resources available to students, the demand is outstripping what providers can offer. This will clearly be an area that providers will want to drill into to see what more can be done to better support students, and the issues are often illuminated powerfully through the open text comments. The word cloud below brings out the most common cited words from the student support category, and it is unsurprising that mental health and wellbeing feature prominently.
Facilities and halls
Two categories where scores increased between 2020 and 2022 was in relation to university facilities (+1.5 percentage points) and halls and accommodation (+2.6 percentage points).
In both areas, large numbers of providers have continued to make significant investments into their facilities and the provision of accommodation both before, and in some cases during, the pandemic. And this appears to be bearing fruit – with students continuing to have higher rates of satisfaction year-on-year. Indeed, this is a trend that dates back to 2018.
| Category | 2018 | 2019 | 2020 | 2022 |
|---|---|---|---|---|
| Halls and accommodation | 3.70 | 3.77 | 3.81 | 3.91 |
| Facilities | 3.97 | 4.03 | 4.11 | 4.17 |
Regions and groups
In terms of the geographical spread, providers in the Yorkshire and the Humber region managed to contain the decrease in overall satisfaction only falling by -0.2 percentage points from a score of 4.20/5 to 4.19/5, however it was students in North Wales who as a region were most satisfied overall, with a score of 4.26/5.
Students in South Wales saw the biggest drop in satisfaction from 4.32/5 to 4/5, equivalent to a drop in satisfaction of -7.4 percentage points.
| Region | 2020 | 2022 | Change (percentage points) |
|---|---|---|---|
| Yorkshire and the Humber | 4.20 | 4.19 | -0.2pp |
| Northern Scotland | 4.17 | 4.13 | -1.0pp |
| North Wales | 4.31 | 4.26 | -1.2pp |
| South East England | 4.17 | 4.10 | -1.7pp |
| West Midlands | 4.14 | 4.06 | -1.9pp |
| South West England | 4.25 | 4.15 | -2.4pp |
| Central Scotland | 4.15 | 4.05 | -2.4pp |
| East Midlands | 4.30 | 4.18 | -2.8pp |
| Eastern England | 4.23 | 4.07 | -3.8pp |
| Southern Scotland | 4.22 | 4.01 | -5.0pp |
| Greater London | 4.03 | 3.82 | -5.2pp |
| North East England | 4.20 | 3.97 | -5.5pp |
| North West England | 4.26 | 4.02 | -5.6pp |
| Mid Wales | 4.53 | 4.25 | -6.2pp |
| Northern Ireland | 4.27 | 3.99 | -6.6pp |
| South Wales | 4.32 | 4.00 | -7.4pp |
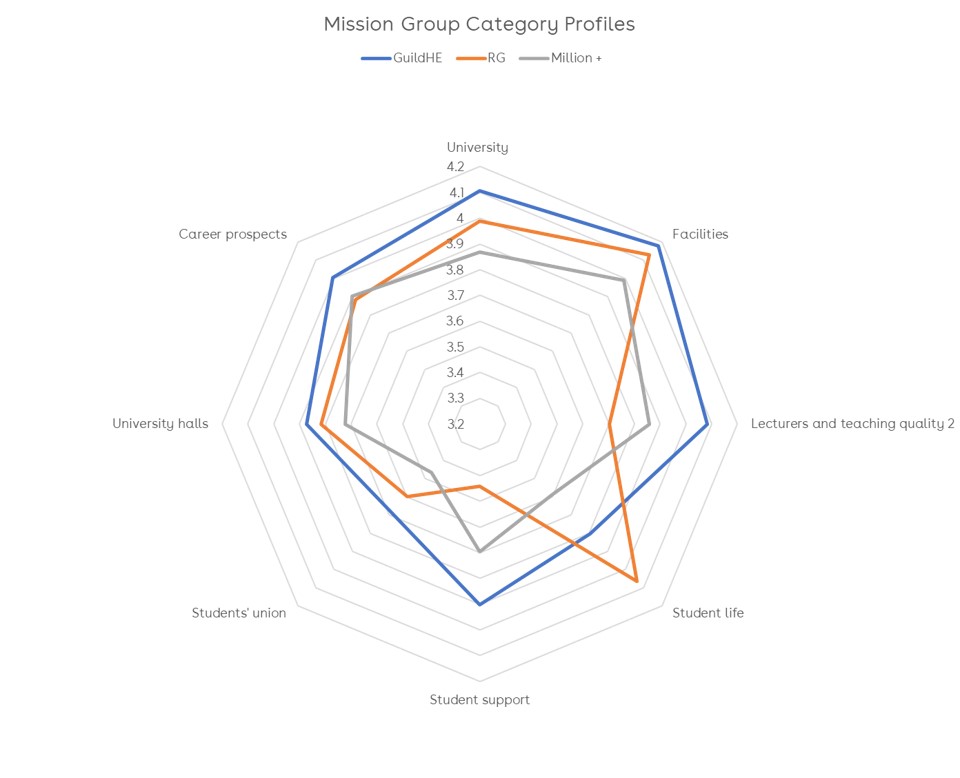
When comparing three sector mission groups (the Russell Group, Million+ and GuildHE) there are interesting differences in scores.
Almost across the board, GuildHE institutions were the top performing category, only being beaten in the student life category (by Russell Group providers) but coming out on top in the others. Generally, GuildHE members are smaller, more specialist providers, and the analysis of the open comments demonstrates how community, belonging and inclusion have all played a crucial role in supporting higher levels of satisfaction in these institutions.
We should congratulate University College Birmingham, who with a score of 4.38/5 (87.6 per cent) had the most satisfied students of any institution, pipping to the post Nottingham Trent University (4.37/5, 87.4 per cent), and the University of Sheffield (4.36/5, 87.2 per cent)
Key takeaways
Given the strategic decisions that institutions are needing to make about what provision should look like for the next few years, and with pressure from government for a complete return to pre-pandemic provision, the data suggests the picture is a little more complex.
In the lecturers and teaching quality category, though there was a modest drop from 4.00 to 3.95 out of 5 in terms of satisfaction, the open comments offer lots of evidence that elements of online teaching were really valued by students. But there are are complex disciplinary differences, and the wider circumstances of students are clearly important.
As always, when institutions are looking to make further improvements to the student experience finding out what their students are actually saying is the best starting point.


Interesting article! A pity comparisons of such small differences are no accompanied by some measure of certainty. Any data comparison in this “league table” format is usually highly flawed, and hides the spread and distribution (as well as the uncertainty) in the data. It suggests an ability to measure each question absolutely, and hides the different aspects of the answers that can be found in the data.
Absolutely Niels! I despair at aggregate measures that do NOT have significance confidence levels.
Also it has been well known for several decades that response to student satisfaction varies massively by subject and course nature.
A student completing a midwifery degree has a totally different approach to their satisfaction – “national prescribed curriculum + degree completed + job obtained = 100% satisfaction (or thereabouts)” – compared to a student completing say a film studies degree where criticism (and finding fault) is actually TAUGHT as a key element of the curriculum. The use in the NSS of a five point likert scale where the mid point is interpreted as dissatisfaction is also highly dubious.
Changes in individual subject proportions and responses matter at aggregate level! A change in the balance of enrolled numbers between disciplines can easily produce institutional level change that appears counter intuitive but are accurate – I once had to explain to a Principal how course completion rates can increase on every course from one year to the next, but the “overall” institutional rate actually falls, simply because the lowest scoring courses expanded and the highest scoring courses declined in volume. If institution X increases its enrolment on Film Studies (or Architecture or literary criticism or social science … etc) but decreases enrolment on midwifery (or nursing or civil engineering etc), their overall score for student satisfaction will decline at the margins even if every single course increases its satisfaction score!
The only valid satisfaction comparisons are those that break each institution down by subject/type of course and benchmark their score to the variance (positive or negative) to sector subject averages, then build back up the institutional benchmark by volume weighting, then a statistical significance test applied to the overall score. This concept is centuries old and it’s getting on for 20 years since it was first raised (in a study by Paula Surridge for HEFCE) in relation to NSS/student satisfaction scores. For me it was an issue that had to be addressed 30 years ago in an institutional student satisfaction survey I was involved in. I despair it still has to be raised.
Going from my own experience at my institution, it is this idea of the ‘new normal’ that is failing students. This is not because of the university failing to put any effort in, but students attendance falling across the board for labs and lectures because they see it as too easy to catch up online. By doing this they miss out on doing things physically and being able to ask live questions.
What institutions should be looking to do is go back to the old normal of 100% in-person teaching thereby forcing the hand of students to either attend or miss out and let them as adults take charge of their own learning.
While I see the line of argument in wanting students to attend in person, it is not as simple as ‘forcing’ students back onto campus, firstly because it does not work and secondly because it is inaccessible. Not all can always attend in person, and this overlooks the benefit that online learning, when done to a high quality, can give students and staff. Given the anxiety levels of students across the country, I don’t think forcing them back into labs is going to solve these dissatisfactions, but simply create newer, different ones. What is important, is ensuring that the quality of both online and in-person learning is high and accessible for the students.