One of the questions that people frequently ask me is: what’s the point?
If you are thinking that this is a fairly broad question for August, let me reassure you that the question is specifically about data (I am sadly unable to help with your more general existential crisis).
The argument goes that we have all this data that tells us things about higher education, so rather than me writing about the intricacies of data collection and suchlike, why don’t I focus on what the data tells us and what we could do about it.
It would, frankly, be easier for me too. Whoever releases the data generally digests the interesting points for you, and you can find others just by looking for interesting shapes in the graph. “Number go up” (or, indeed, “number go down”) is the straightforward crowd-pleasing headline that everyone wants.
Homework
My perspective has always been that if you want to do the fun stuff like that (and the even more fun stuff of coming up with regulatory interventions, or adding to the seemingly endless list of Things Universities Really Need To Do Right Now) you need to understand the process and decisions that have led to the numbers and charts you are looking at. This is true for every year and every data release – but the 2022-23 release of student data makes my lonely subtext into the main text.
You will, by this point, already be familiar with the saga of Data Futures. If you’re holding out for the film (an unflinching study of the way idealism descends via pragmatism and administrative convenience to abject misery and pain) be aware that (i) we changed the way student data was collected for 2022-23 and (ii) it didn’t work very well.
HESA has released open data (in the form of a statistical bulletin, or SB) from the 2022-23 Student collection. Generally, this is the one that comes out in the early days of January each year. I’ll plot some bits of that as we go, but the main focus of this article will be the parallel (and less publicised) release of the “quality report” for the student data collection (a summary and overview, and detailed insight data).
If you got data problems I feel bad for you son
That last link is gold. There are 99 declared issues with the data as released – expanding hugely on what we were told alongside the OfS dashboards update. You could see them in four groups:
- In some cases the design of a data field has been updated, making for a deliberate discontinuity with previous collections. An example of this would be the changes to the way disability is recorded – each student can now have up to nine different disabilities recorded, a big step up from the old “Two or more impairments and/or disabling medical condition” option.
- There are instances where there have been general, sector-wide problems, with data submission. Examples here include large amounts of missing data for socio-economic classification (SEC) and parental education in England, or increased levels of “unknown” term-time accommodation.
- There are instances at particular providers – for example, an implausible 12 per cent of all students at De Montfort university have been returned with the sex field marked “not available” or “information refused”, while a deeply unlikely 20 per cent of students at Edinburgh Napier University have an “unknown” nationality.
- Finally, this is the dataset which covers the (graduating) year of the UCU marking and assessment boycott, so at some providers there will be a “qualifiers” undercount this year (and a consequent overcount next year).
Any change to a data collection is going to bring about some changes to the quality of collected data. In the main this is not an insurmountable problem. Even for 2022-23, HESA reports that:
There are no cases in which the data submission from a particular provider has been deemed of sufficiently low quality to warrant its suppression. Nor has any specific data theme presented quality concerns at a level needed to justify its removal from the HESA official statistics
For continuing students, it has largely been possible to fill in “unknown” data using submissions from previous years. This isn’t perfect (a student may have developed a disability, changed subject of study, even changed gender during an academic year) but it makes the collection as a whole more credible.
Credibility and accuracy
It’s a mistake to talk about accuracy in sector data. Without independently recreating everything single data point (at mind-bubbling expense), it is impossible to measure and a thus poor choice of goal. Instead, data professionals talk about credibility – given what we know about a provider or student body, is what has been returned credible. It was the credibility checks that identified the level of “unknown” values in certain fields and from certain providers – and continuity between values this year and in previous years where it has been possible to do a mapping.
You’ll note from the SFR that much of the data released today does not include a time series. This makes it harder for the independent user to spot places where values have changed unconvincingly year on year – a full open release, expected at the end of August, will offer more insight here. In the meantime, we can see some of the phenomena we have been talking about in the student characteristics overview.
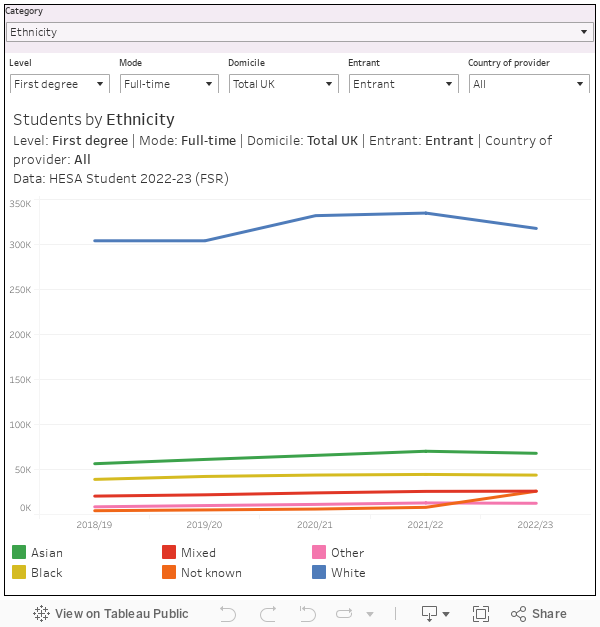
So, by default, we are looking at ethnicity among full-time first degree UK domiciled entrants (people who have begun a higher education course in the year in question). At first glance you could spot a decline in the number of white students over last year – and if you were so minded you could begin telling yourself all kinds of Matt Goodwin-esque nonsense about the white working class turning away from elite culture.
However, you will also spot a sharp increase in the number of students where ethnicity is not known – something which (again “age of identify politics” or whatever if you like) seems implausible. What you are in fact looking at is an artefact produced by one of the problems identified within the 2022-23 data collection.
All of which is interesting, until you remember that we regulate based on stuff like this. Using this very data. And if you explore the visualisation, you’ll encounter other issues (which HESA has helpfully documented here).
The basics
Student characteristics are a complex issue at the best of times – but surely nothing could be easier than counting how many (Scottish domiciled full-time first degree) students there are at each provider?
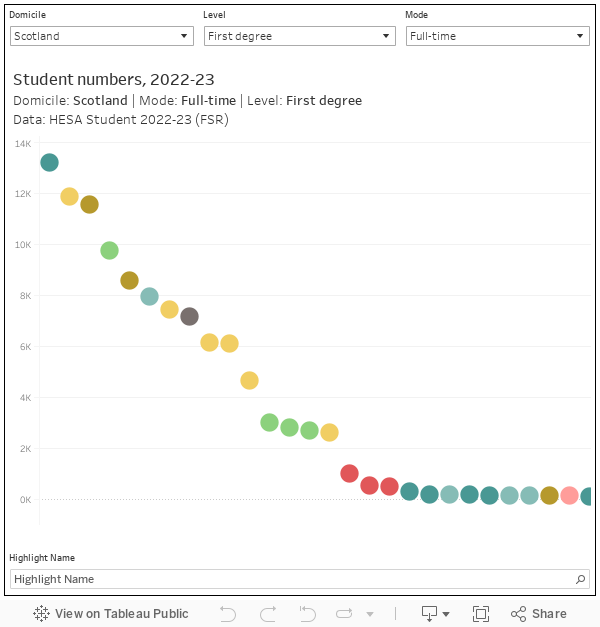
Ah, well. We’ve got a big problem when it comes to “permanent” (home) address for both entrants and continuing students – in the latter case it’s not always been possible to retrieve this information from previous years. Things are looking a bit better with level of study, although there are 550 postgraduate students at Queen Margaret University Edinburgh that have been incorrectly reported as undergraduates. Meanwhile on mode of study there is a small but significant issue related to a change in the way sandwich students are coded, alongside specific issues at the University of St Andrews and the University of Edinburgh.
It’s not such a long time since England’s regulator was particularly concerned about grade inflation in degree classifications – indeed, there are three investigations currently underway. On the face of it, we are looking at good news – the proportion of full-time students graduating with a first class honours degree is down from 35 per cent in 2019-20 to 29 per cent in 2022-23.
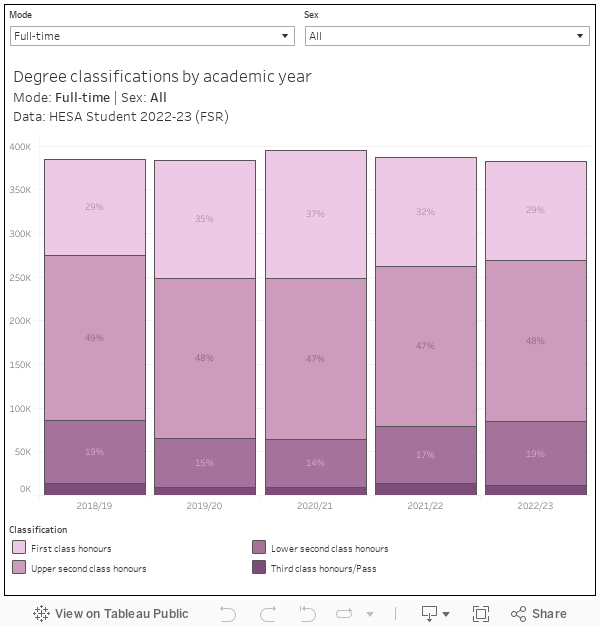
However, within this we have the continued unwinding of the Covid-19 effect (with the end of “no detriment” arrangements”), the impact of the marking and assessment boycott (with many providers expected to return qualifications that otherwise would have been awarded in 2022-23 next year). On top of this, there’s some issues with double counting.
While it is fair to see this release as a compilation of data submitted as part of the 2022-23, it would be unwise to see it as part of a time series for regulatory purposes – especially when we get down to provider level.
Knowing what we don’t know
This years’ immensely delayed statistical first release is even more tentative than in previous years. HESA has been rightly cautious in interpreting and presenting the data available – the generous use of caveats and explanatory notes is to be commended. Though 2022-23 is far from the data disaster some predicted (and you could point to issues with any year of any data collection), there are clearly issues both created by the collection process and by externalities that need to be accounted for in any release or use of the data.
HESA (as the responsible arm of Jisc) gets a coveted gold star from the Office for Statistics Regulation (OSR) for the way it:
proactively and openly shared information with users on the quality assurance process, [and] supported continued trust in the statistics and provided users with valuable information that will inform how they use the statistics
It did a difficult job, well, in difficult circumstances. This makes the release of data derived from the same collection – in more detail and with less safeguards – by the Office for Students earlier this summer all the more remarkable. The dashboard release was not caveated or explained to the same standards, and it came in advance of the official open data release – two issues that the OSR will be paying very close attention to.
What’s the point of this? Well, if regulatory decisions are being made on the basis of non-credible or incomplete data we have a pretty major problem. There will need to be a contextual adjustment to OfS processes – this should be transparently documented, and (again) the issues should be displayed alongside the data itself.
We’ll return to this issue on 29 August (the majority of data tables), and again on 12 September (11 stragglers, including a large number of domicile related provider level information).