


The government has today published Longitudinal Earnings Outcome (LEO) data which links graduates with employment, benefits and earnings information. The data links HMRC’s tax records and other sources to education data to give an accurate picture of individual graduate earnings, something only made possible by recent legislation.
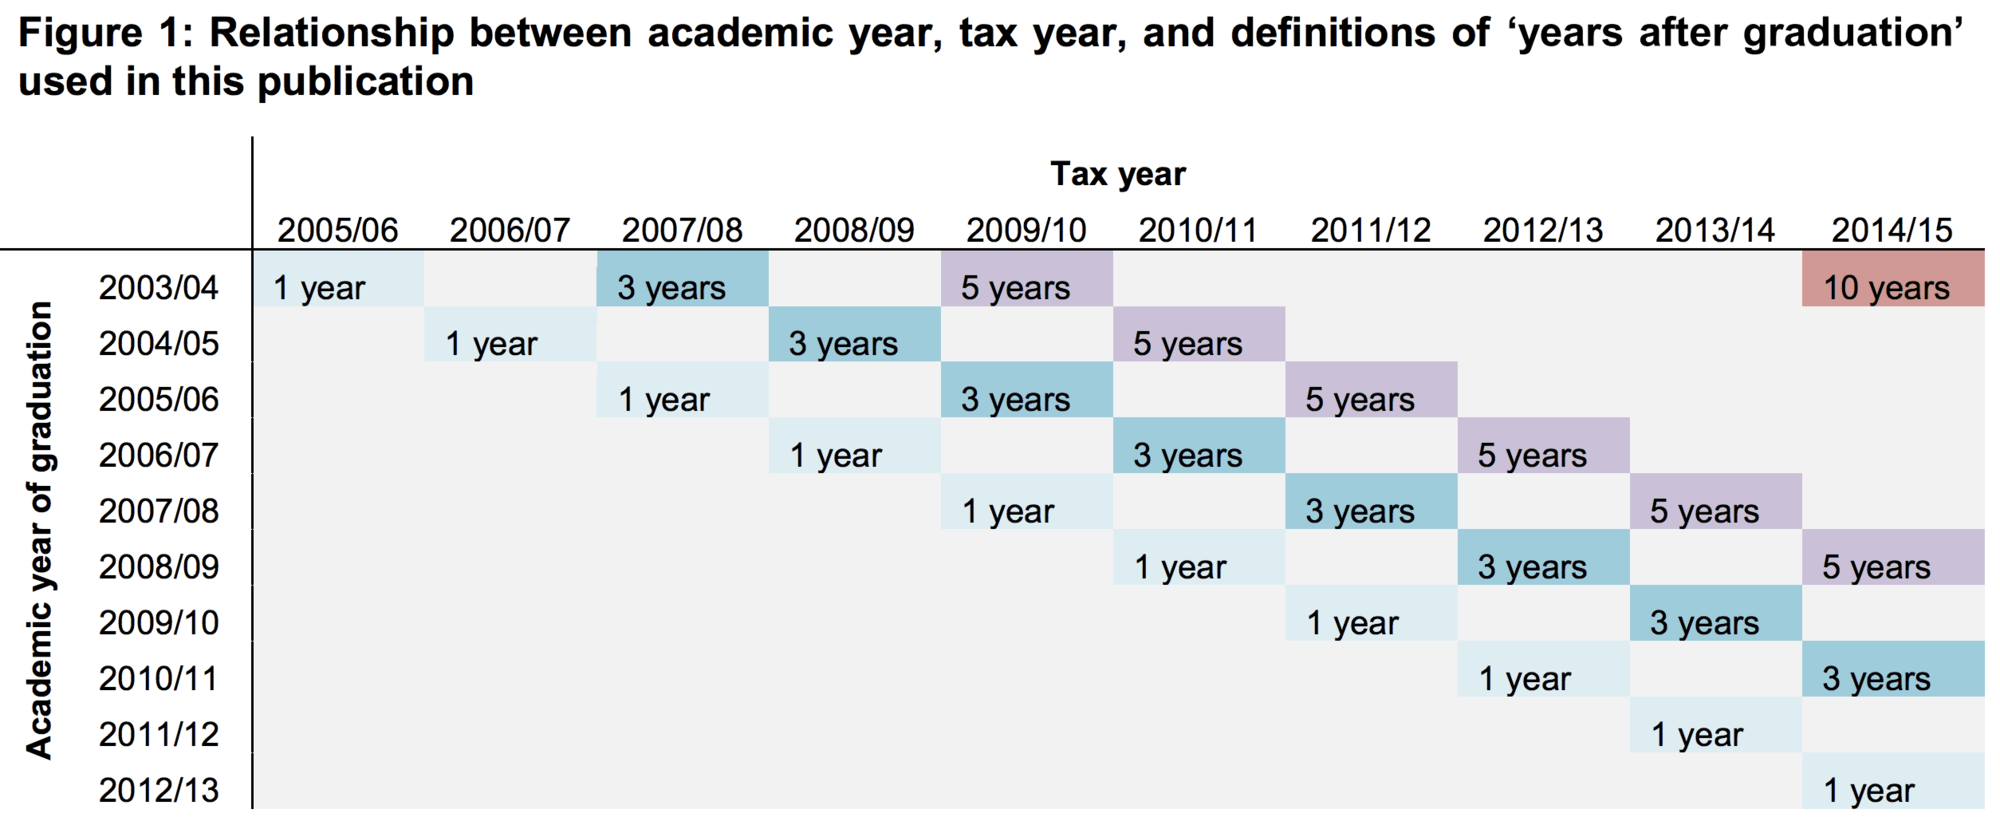
Today’s release was promised in the White Paper earlier this year and breaks down the data by gender, ethnicity, subject studied, and crucially, institution of study. It covers graduate cohorts from 2003/4 to 2012/13 and show outcomes one, three, five, and ten years after graduating and further data has been published about Law, but no other subjects which will follow in the Spring of next year.
Today is only the start of a long process of analysis and understanding of the data and what it shows.
Read: lessons from the LEO data – five lessons we can draw from the new data.
The caveats
The first thing that is notable about the LEO release is that it is raw data. None of it is controlled in any way – or interpreted in the accompanying reports. It is therefore very different from the recent IFS report on graduate earnings whose conclusions were based on controlling for various variables. None of this data can be interpreted as ‘value add’ because the student bodies are so distinct at different institutions. Further, this is not graduate premium information, which assesses the net benefit to an individual of going to university allowing for costs, time out of the labour market while studying (lost earnings), higher earnings (net of tax and loan repayments).
Back in April, when Wonkhe interviewed Jack Britton from the Institute for Fiscal Studies about their work on graduate earnings, we discussed the government’s plans to release raw data by subject and institution. Britton warned: “For the purposes of really understanding the value added by subjects and institutions the raw data is not very helpful since it does not allow us to compare like with like.”
Although the White Paper indicated that “this rich new data source will give students the information about the rewards that could be available at the end of their learning, alongside the costs” (Chapter Two: Choice, §42), at present it is very hard to interpret beyond the obvious headlines that the following are good bets: going to Oxford, Cambridge and LSE or doing economics and medicine.
The government’s ambition was for this “authoritative data … to facilitate an improved understanding of the value added by a higher education degree” (our emphasis). We don’t yet have that understanding – more work is needed to interpret the data – particularly in the release relating to Law: it throws up a series of questions but doesn’t answer those questions.
This first statistical release looks at graduates since 2003/04 who were UK-domiciled prior to the start of their course i.e. it covers home students only.
Data on earnings and employment activity are split by subject studied and graduate characteristic (sex, ethnicity, age, home region and prior attainment at A level). Data by HEI is for employment activity only, except for the Law data which is by institution and includes earnings.
In the report’s sections on Employment Outcomes, the report adds the following caveats on making comparisons between institutions:
“It is important to note that differences in institution level outcomes can be influenced by a range of factors beyond the educational benefits provided by that institution, for example: the subject mix offered; the characteristics of the student intake; and whether an institution’s students are more likely to undertake activities after graduation that the data does not capture well, for example self-employment or working abroad. Outcomes may also reflect a particular set of factors in a given year, including random variation, and therefore may not be indicative of sustained performance. Comparisons between different institutions’ outcomes should therefore be made with caution.” (p. 35)
Given the previous headlines about Creative Arts, it is important to note that this subject area and the institutions that specialise in its teaching have particularly disadvantaged. LEO only has access to self-assessment data on earnings for 2014/15, which means it is absent from the majority of the data published.
For Creative Arts as a subject over 9% of graduates were in self-employment five and ten years after graduation and it appears that “high-tariff” graduates in those subjects are more likely to be self-employed (in general high tariff students fare better on activity and earnings measures across all subjects). The report notes that this affects the activity data at specialist institutions:
“There is substantially more variation in the impact of self-assessment records when data is considered at an institution level rather than at a national level. For some institutions, inclusion of self-employment information has no effect on the proportion of graduates in a positive employment or study outcome. For others, self-assessment records can account for almost 40 per cent of an institution’s sustained employment outcomes.
Institutions with a focus on the creative arts are particularly affected by inclusion of self-assessment data; indeed, the ten institutions with the highest proportion of sustained employment outcomes defined by self-employment records were all institutions with a focus on the creative arts. This may reflect the fact that students from these providers are more likely to pursue non-traditional employment routes. Therefore, inclusion of self-employment data is necessary to better understand graduate activity at an institution level.” (p35-6)
The self-assessment data is activity only. LEO does not have access to self-assessment earnings records – therefore these sums are absent from the graduate earnings data. The earnings data does not distinguish hours worked so not allowance (e.g. pro rata) can be made for part-time working.
There are also problems with the use of JACS codes to group subjects in the LEO data. As Mike Picken points out in the previous discussion about this data, “JACS codes are totally incapable of distinguishing between eg the highly vocational craft-based courses often delivered at specialist institutions (or within multi-faculty ex-polytechnics/new universities often created by mergers with those formerly specialist institutions), and the ‘more academic based ‘study of a discipline’ that you would typically find in a Russell Group University. This has the effect of skewing the data about graduates working in the creative arts, as not only are there courses not adequately understood inside the data, the sorts of casualised jobs and ‘portfolio careers’ they are likely to be undertaking are not easy to compare with those working in full-time employment for a single employer.
The lag
What might seem the most relevant data, the ten year review of graduate earnings (assuming that the majority of graduates have by this stage established a career in their early thirties) suffers at this point from two problems. Only one cohort, those who graduated in 2003/04, is available for these data and that means we are looking at individuals who made their choice about courses and institutions back in 2000 – sixteen years ago. There is an unavoidable lag in this data – we are discussing the results of courses being run a while ago, these outcomes may have little resemblance to the outcomes from today’s courses.
“The main tables look at those who graduated in 2008/09, the latest year for which we have a five year time series.” So the “lag” here is roughly a decade. It is also the cohort who entered the labour market at the start of the financial crisis and are now mostly in their mid-twenties.
The ‘informal consultation’ response
Alongside the data release, we have a statement from DfE in response to its ‘informal consultation’ on the LEO data. You may by now be familiar with this line: comments came in, were read, not much changed as a result. It is a pretty obvious conclusion that the LEO data will be used for league tables, and that not every institution would be in favour of that. However, the clearly stated aim of the exercise is to provide information for students:
“Overall respondents expressed support for the publication of the LEO data. Having relevant, accurate and reliable data on graduate’s employment is helpful for prospective students and their families, to help them asses [sic] their options and is also useful for higher education providers for institutional planning and assessment.”
Understandably respondents urged the need for caution in the use of the data, and context to be provided, but it seems this particular cat is out of the bag. Subject-level and postgrad outcomes were called for, both of which will feature in future data releases.
What’s next?
It seems like LEO will provide much more data and far more opportunities for analysis for months if not years to come. Having tantalised us with this release, the next – due ‘spring’ 2017 – will include more detail on the outcomes for individual institutions. That is, we’ll be able to see salary data, and subject-level results, as well as the proportions of students, employed. There’s also the promise of data on postgraduates further down the line, to add to this undergrad-only release. Unlike with the data published so far, institutions are going to get sight of their data before the spring release as the level of detail could have deep implications for individual courses and institutions.
And looking further ahead, we should expect LEO releases to form a key part of the annual cycle of data on the sector. We should also anticipate the use of the data in league tables and possibly its eventual incorporation into the TEF, as HESA admit the data is more comprehensive than that offered by DLHE, and so are looking how it can be incorporated in DLHE’s successor.
Five lessons from the data
Also on the site, David Morris has been delving in the data and has found five key lessons from today’s release: the gender gap, the importance of prior educational attainment and what’s going on in the legal profession.