

Student incomes have almost doubled in a year. Or have they?
Jim is an Associate Editor (SUs) at Wonkhe
Tags
Apparently, despite the economic challenges facing students, the average number of hours they are spending in part time work each month has decreased this year from 43.16 to 18.3.
What are they doing instead? Coursework! The number of hours they are spending studying per month has increased from 84.42 to 119.35, with socialising and hobbies other areas where time is being saved.
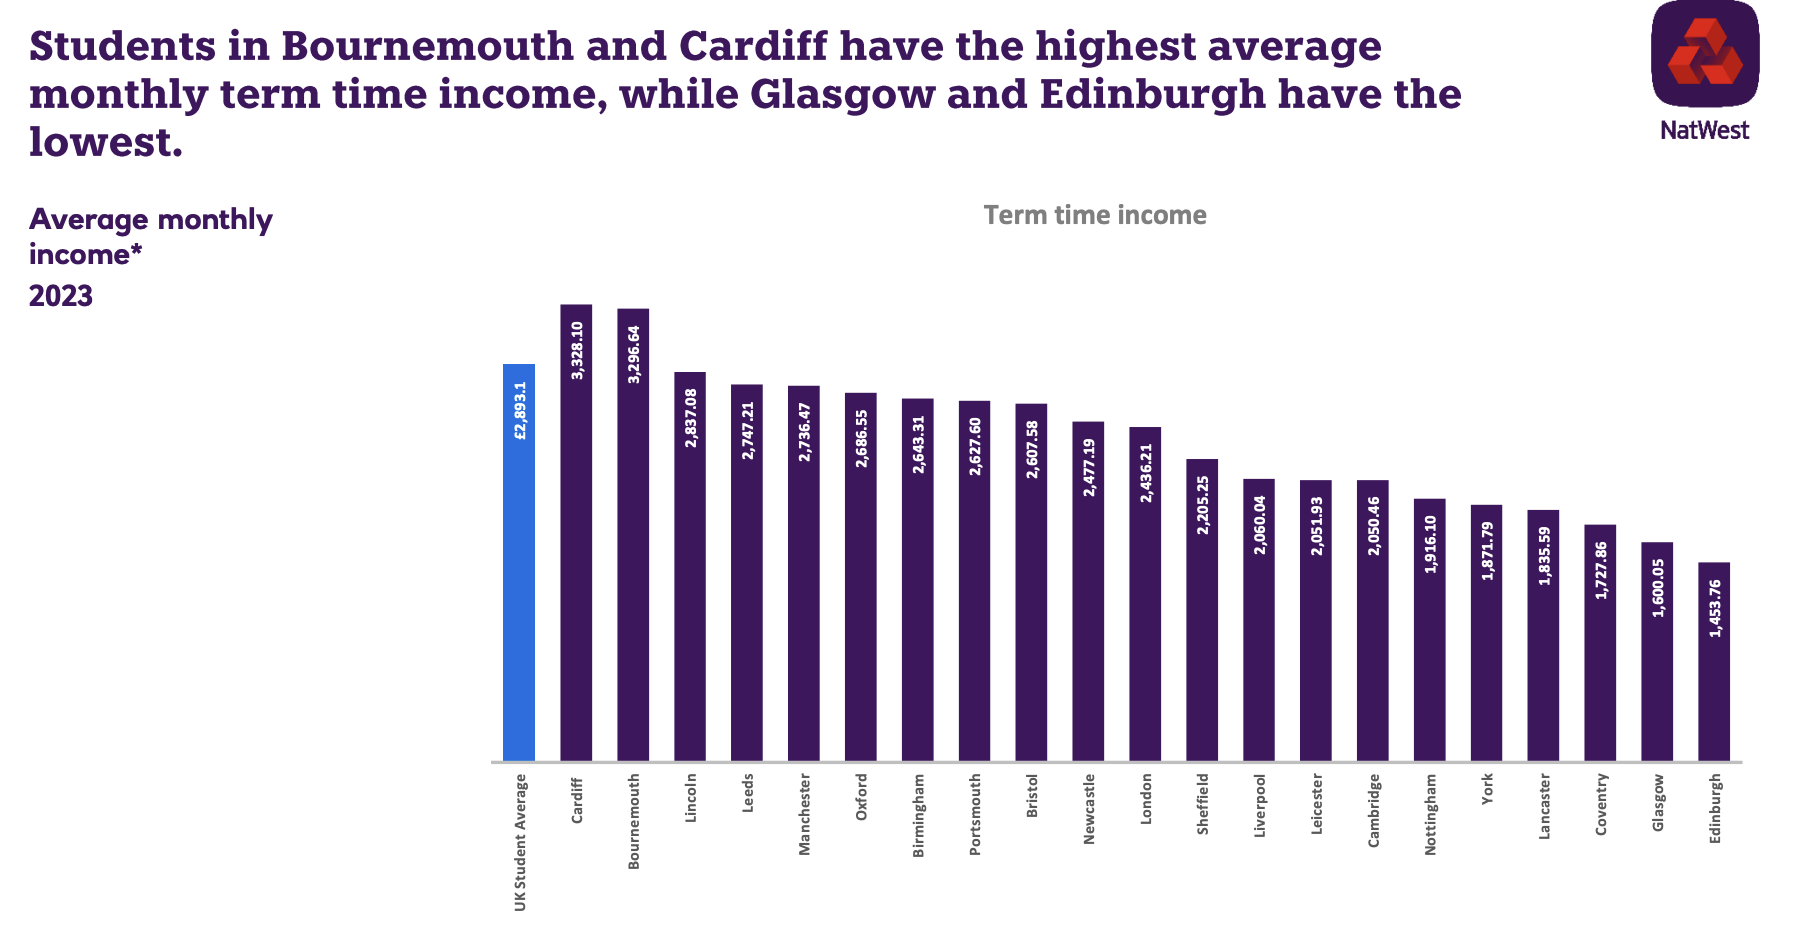
Despite the cost of living crisis, students’ spending in supermarkets has increased by 44 per cent since last year. And contrary to popular belief, students’ average income has somehow rocketed – from £1,805 a month to £2,893 a month.
And in a remix of the ultimate HE rivalry, “the price of a pint” (of what? Hope?) has reduced by 50p in a year in Oxford – but increased by £1.47 in Cambridge!
Can you imagine seeing those numbers and then, trading on your reputation as a high street bank, actually pressing send on an 88 page PDF that you know will be picked up by the press, universities and first in family students relying on the information in the absence of anything better?
The above are amongst the headlines from this year’s NatWest Student Living Index, the exercise that in 2021 told us that students in London were paying £9.10 a pint and in 2022 suggested student rents in Edinburgh had fallen to £200 a month.
It’s all very sample
This year the research reputation-destroying wooden spoon has passed to Redbrick Research, and the sample is 3052 university students living in the UK, completely unweighted for characteristics, domicile, location, profile, or anything really – with the fieldwork carried out mainly in July (it was May last year).
Despite that we are treated to region, city and in some cases provider level conclusions – which judging by previous years will be plastered across clearing marketing for first in family students to rely on before you read to the end of this piece.
To give you a sense of this, the sample sizes for the places used in the bar charts are as follows:
Birmingham (157), Bournemouth (52), Bristol (148), Cambridge (35), Cardiff (49), Coventry (48), Edinburgh (79), Glasgow (82), Lancaster (57), Leeds (85), Leicester (72), Lincoln (60), Liverpool (171), London (258), Manchester (177), Newcastle (97), Nottingham (160), Oxford (34), Portsmouth (89), Sheffield (207), York (63).
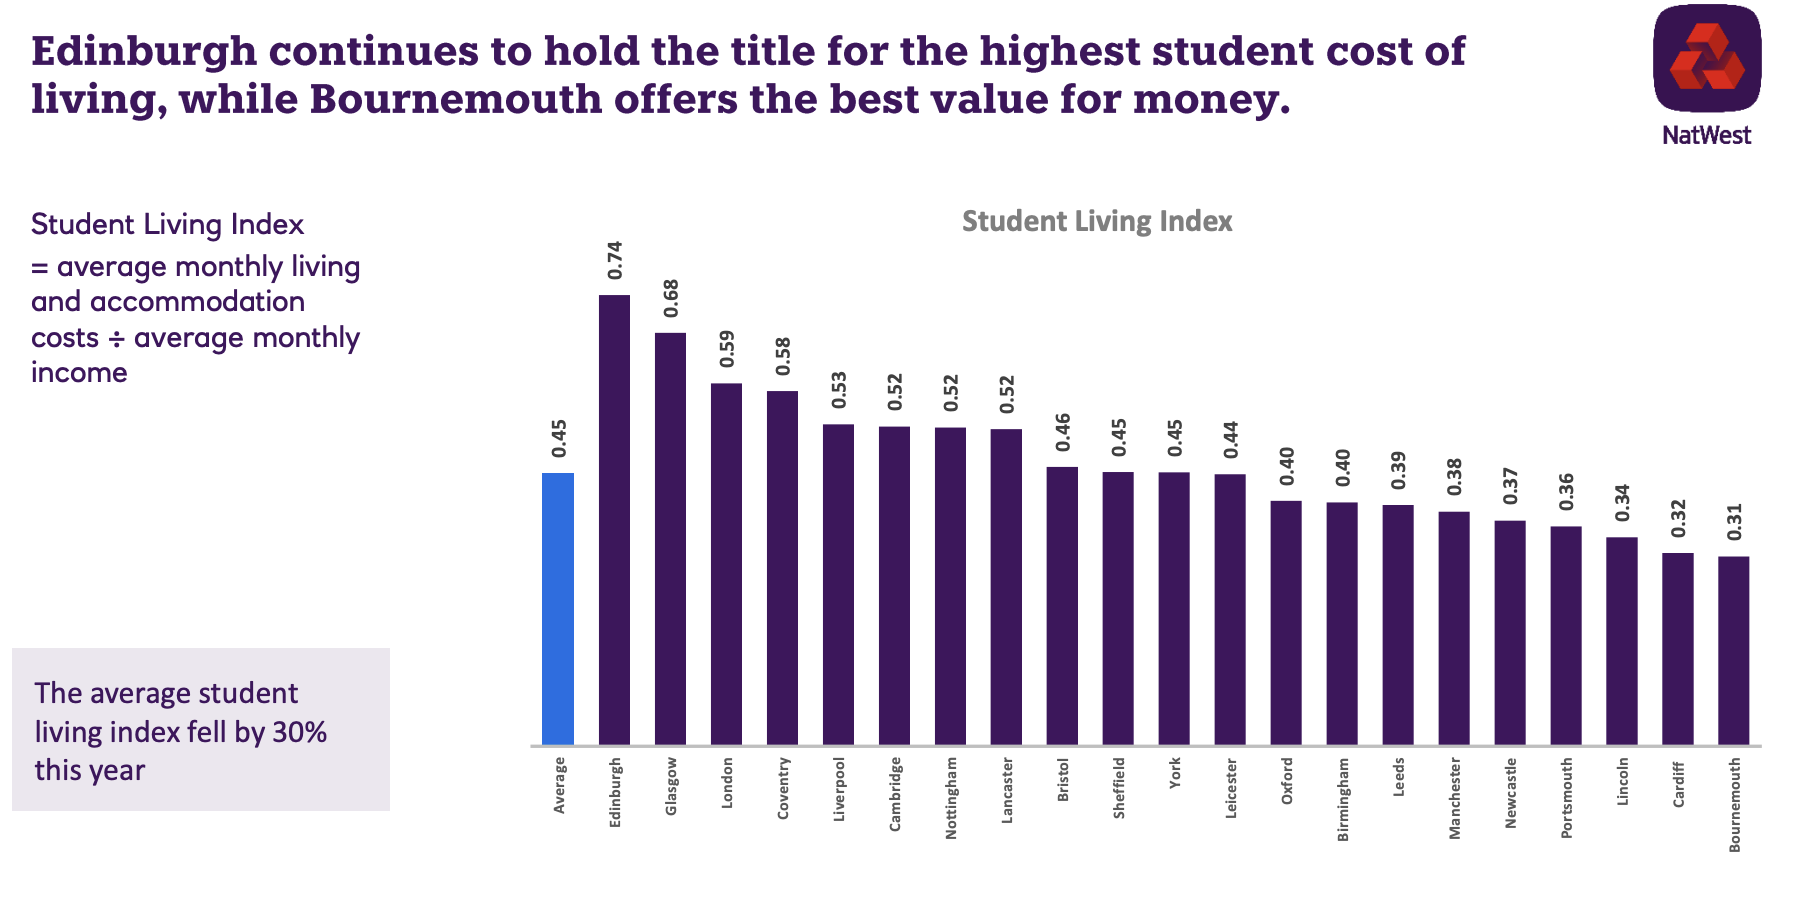
The main conceit of the exercise is this concept of the “Student Living Index”, which is worked out by taking average monthly living and accommodation costs and dividing them by the average monthly income. The lower the number, the “better” the score.
The good news is that after falling by 22 per cent in 2022, the Student Living Index has dropped again, this time by 30 per cent. The bad news is that if your costs and income figures are dodgy, the calculation methodology of the index multiplies the dodginess.
So for example, it says that Edinburgh, Glasgow, Leeds and Canterbury have replaced London as the regions with the highest student cost of living, Edinburgh is the only city in the UK where student spend/costs outweigh their income, and the best student living index this year goes to Cardiff – its index score having halved from 2021 to this year.
Apparently, this all may be due to a “mix of a heavier reliance on term time incomes from student loans” and a “reduction in spending on typical activities and items since last year”.
Of course it may also be the wildly different characteristics of the sample.
Cardiff’s streets are paved with Gold
On student incomes, for example, we are expected to believe that students in Cardiff have gone from £2,241 a month to £3,328 a year, with students in Coventry moving from £2,241 a month to £3,181. Meanwhile the poor souls in Leicester have supposedly seen a collapse in their income from £2,508 to £2,051 a month.
Underpinning that income are various sources – one of which is student loans, which NatWest says has gone from £714 per month per student to £1,427. We are also expected to believe that time spent on academic activities has gone from 84 to 119 a month, and expenditure on those activities has gone from £67 a month to £25 a month.
Meanwhile we are that that hours spent in employment has gone from 43 a month to just 18.
With this sort of obvious nonsense, the place-based conclusions get even worse. We are told that Newcastle students have somehow gone from working 43 hours a month to 23, that Manchester students work 18 hours a month where last year they worked 42, and that students in Glasgow now work 16 hours a month where last year they worked 40.
The expenditure stuff is just as wild. Average student expenditure in Leicester has somehow collapsed from £1,684 to £912, it’s gone from £1,666 to £1,004 in Coventry and it’s now £1,050 in Manchester compared to last year’s £1,583.
Household bills in Leeds have somehow collapsed from £115 a month to £46, from £103 to £42 in Newcastle and from £107 to £16 in Leicester – while they’ve shot up from £11 to £64 in Coventry. It could barely be more obvious that we are looking at accommodation types inhabited by the sample here.
There are lots of takeaways
Students don’t just spend money on rent, though. Spare a thought for students in Edinburgh who were paying £7 for a takeaway last year but now supposedly pay £16. Students in Cambridge are forking out £17 rather than last year’s £10, and in London the price of a takeaway has gone from £8 to £17!
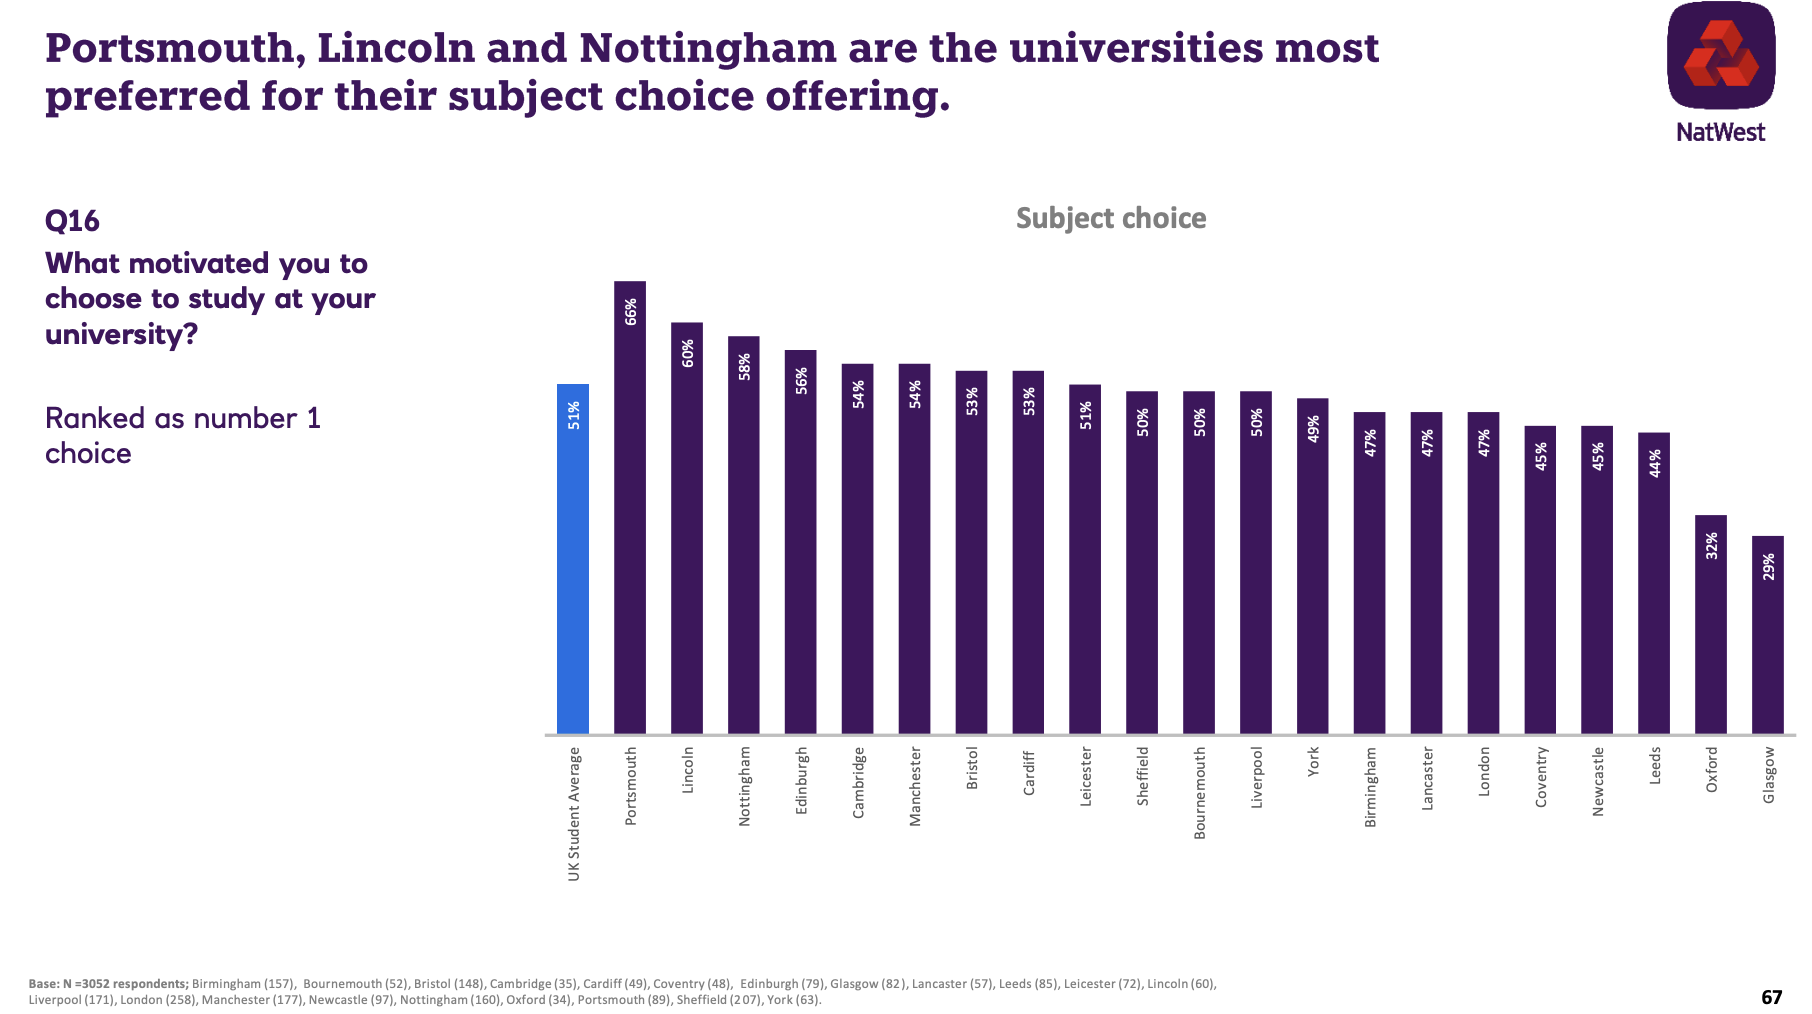
As usual, the PDF plays fast and loose with places. In theory the top six “universities” preferred on the basis of subject choice are Portsmouth, Lincoln, Nottingham, Edinburgh, Cambridge and Manchester – but the sample size on those pages is the same as others describing those places as “regions”.
Maybe the NatWest student account has no customers at Trent, Heriot-Watt, Napier, Queen Margaret, ARU or Man Met, let alone the myriad smaller or specialist places that pepper those areas.
At this time of year at Wonkhe towers we’re bombarded by surveys from all sorts of companies trying to get their name out there. But the problem is that this one carries the imprimatur of credibility, and is used by countless universities in both their marketing and cost of living information for students.
Whoever you are, do poorer students a favour. If you see your university using this dangerous twaddle to make boasts about affordability or presenting this stuff as useful information to rely on when trying to predict the cost of living, walk into the marketing or student support office and stage a sit-in until they stop. It’s immoral.