

Redefining social mobility (again)
David Kernohan is Deputy Editor of Wonkhe
Tags
Social mobility is a matter of definition, and a matter of exclusion.
To improve the chances of people reaching their potential we need to decide how to measure this potential and how to measure whether they have met it. We also need to set out which factors that may have an impact in this, and in doing so which factors we are going to assume (possibly simply because we cannot measure them) do not.
It’s tricky stuff, and the various convulsions of the Social Mobility Commission over the last few years have commendably sought to base findings on solid evidence – with perhaps a consequent lack of attention paid to the cultural, social, and dare we say structural indicators of disadvantage.
The definition of social mobility, as presented in the 2023 annual report by newish chair Alan Francis, goes as follows:
A person experiences social mobility – by which we mean intergenerational social mobility – when they have different life outcomes from their parents. This could mean a different income level, a different occupational class, or other differences, such as housing or education. Mobility can also be upwards or downwards.
This direct parental comparison is at odds with traditional approaches to comparing mobility with, for the want of a better phrase, “people like you”. When the original Mobility Index was proposed, there was some criticism about the omission of structural factors linked directly to ethnicity, disability, and other protected characteristics.
In this year’s annual report, these return. Indeed, one of the headlines is the wide and profound impact that disability has on a person’s life chances – another is the impact of geographic factors on professional employment. There’s also stuff on ethnicity and gender – all of which will have access and participation professionals scratching their heads: these are not, by any stretch of the imagination, new findings.
But are they met with new activity? Possibly. There is, we are promised, a policy paper on the way that will set out how SMC intends to address these aspects within a continuing programme of work. The annual report hints that this will be evolution not revolution.
And there’s data…
Quite a lot is available via the SMC’s own data dashboards – I’ve chosen here to let you play with three area based (ITL2, for some reason, that’s the one below the usual regions we see, but above administrative boundaries) composite indexes. These cover socio-cultural advantage, childhood poverty and disadvantage, and research and development capacity. You can choose what shows up on the X and Y axis of this scatter plot, and add your choice of quintiles as a colour.
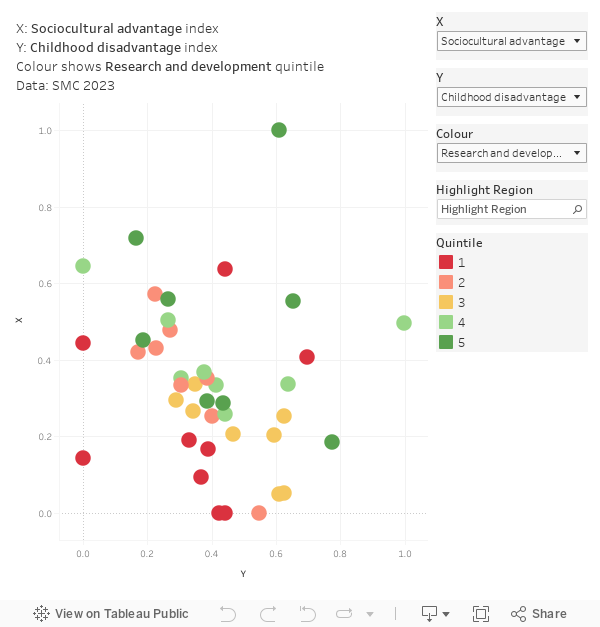
The reason I’ve chosen these is because each relates, in part, to higher education: advantage includes parental university degrees and professional work, disadvantage includes “lower working class” work, and research and development capacity includes the number of university research students. It is notable that a report that can confidently assert:
The traditional approach focuses too much on the university route, pathways to professional careers, and long leaps in social mobility. But we need a wider focus. Thinking only about access to top professional jobs neglects far too many of those at the bottom.
when the indicators used to track social mobility draw so heavily on the strength and value of the university sector.
Overall the report is positive on the current state of social mobility, while recognising that there is – and always will be – work to do. However, the elephant in the room is that supporting more people into higher education would do more for both relative and actual social mobility (the Kinnock effect, if you will) than any other single intervention.