

Looking more closely at the student immigration figures
Jim is an Associate Editor (SUs) at Wonkhe
Tags
That backlash included familiar-sounding calls to remove students from the calculation – on the basis that they eventually, in the main, leave.
It was the favourite line of lobbyists for a decent chunk of the last decade, when folks were trying to persuade Theresa May to reintroduce a post-study work offer.
The “problem” for those trying that line is that the ONS release reminded us that to the year ending August 2019, only 61 per cent left the country at the end of their study visa – and that was without a post-study work offer of two years.
Depending on your outlook, that’s also a potential “solution” to the 1m vacancies crisis – but it’s almost impossible to have calm, sensible or nuanced discussion about immigration and its complexities without the Brexit bifurcation demanding loyalty and hurling insults at the other side.
On top of the YE June 2022 figures, as we noted on the site, the quarter following the ONS analysis (and so not yet in net migration figures) appears to have smashed a series of previous records – and so having a sense of where the lines on the graph go next is quite important.
Here as a companion piece to Friday’s article I’ve gone in a bit deeper to look at what the Home Office figures do and don’t tell us about international recruitment. All of these figures, by the way, exclude those on the dedicated Ukraine scheme(s).
Overall increases
First up we have the total number of visas issued to students. The pandemic is not hard to spot here – what we don’t know is how much of the bounce back is deferred demand from that period versus new and growing demand, and nor do we know how long it will last.
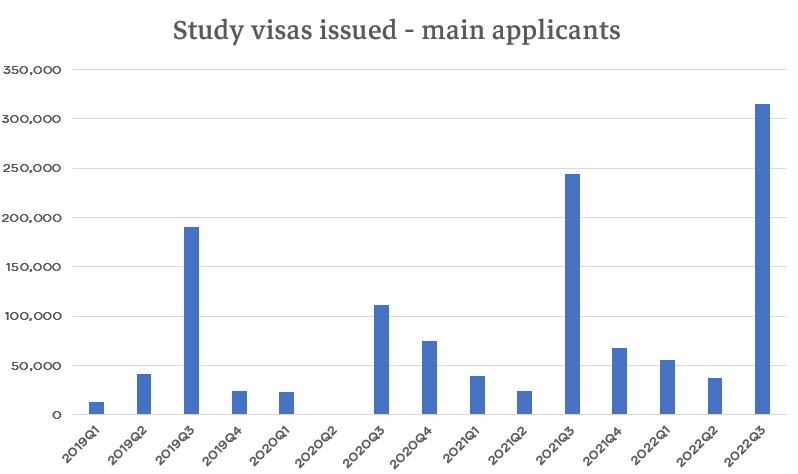
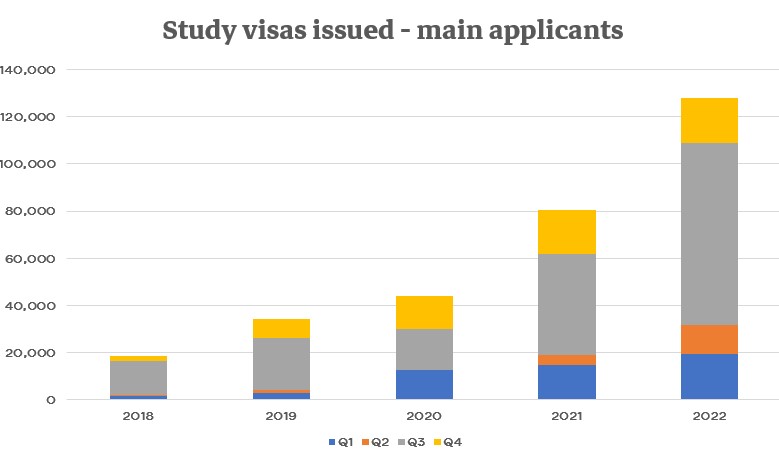
That graph is probably better understood smoothed – here by calendar year. It looks like a steadyish increase, save for the fact that hat 2022 bar is of course missing the final “January intake” quarter.
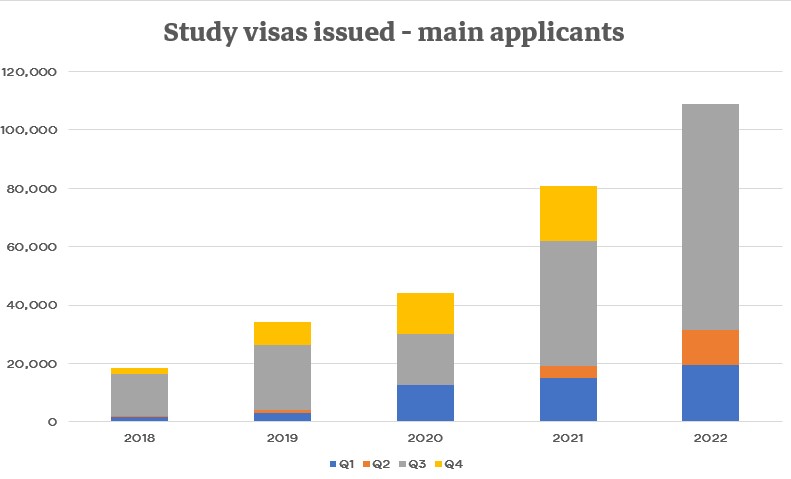
What would help is knowing the number of CASs that the Home Office has issued – that would help us guess that final Q, but we don’t get those numbers. So let’s fly in the face of almost all intel we hear from on the ground and assume the number will match last year. That would suggest that by January, we’ll end up with what I might call a “buoyant” 45,000 increase YOY.
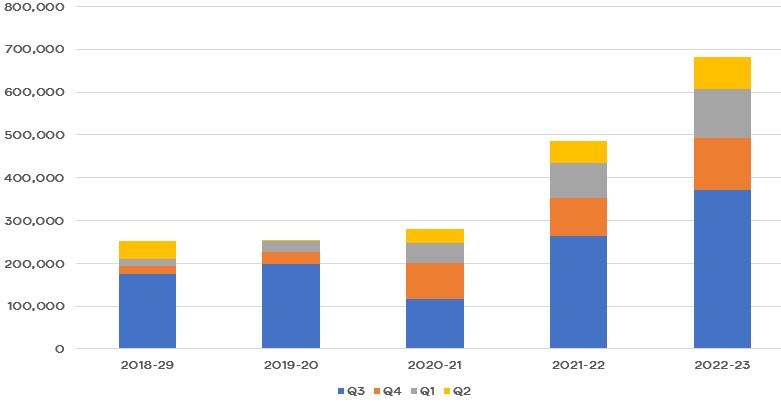
Dependants
But the above charts are all without dependants. Here’s the number of visas issued to partners and children by quarter:

Now what would really help us would be to know how many students were not issued any dependant visas, and how many were issued to partners and to children – that would assist with infrastructure planning and implications (ie issues like the need for childcare or family accommodation), especially if we could see that by country. But we don’t get those figures.
Nevertheless, when we add in the dependants to that calendar year smooth, and we make the same mistake of guessing Q4 to be the same as last year’s Q4, here’s where we get to:
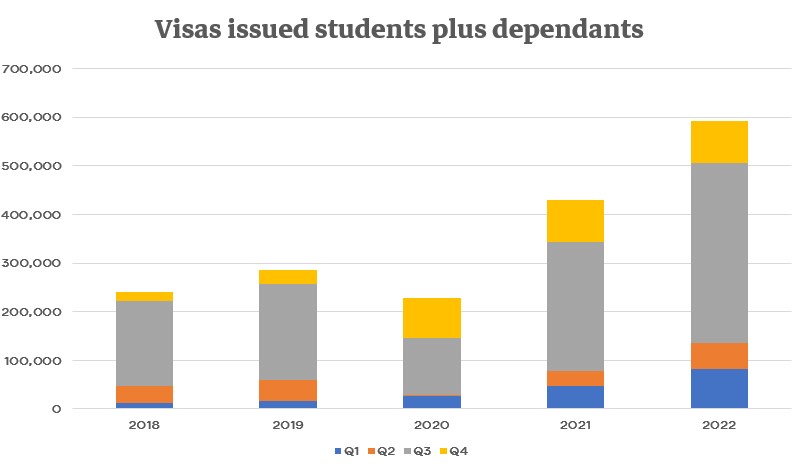
As you can see, that’s a nigh-on 200k increase in a single year. So let’s see if we can work out where those figures might get to by next year’s ONS net migration figures.
This time I’ve assumed that for the next three quarters, we see a 40 per cent increase in visas issued to match the 40 per cent YOY increase we saw in Aug, Sep and Oct. That could be an overestimate as some of the previous year’s increase may have been pent up pandemic deferrals. It could also be an underestimate based on growing demand. Either way here’s where it comes out:
It’s a chart that underlines the problem with the “but they leave” argument. Were it to be the case that all international students largely didn’t bring dependants and were all housed in purpose-built student accommodation, it would make sense to see international students in the same way that we tend to see tourism. But as long as the volume is growing this rapidly, with a decent proportion of that growth requiring family accommodation, it will matter to policy makers. Even more so if via the graduate route, they’re staying longer than PGTs used to.
Graduates
All of the above looks at what we might argue is the recruitment impact of the graduate route. It doesn’t include those that are now actually on the graduate route.
This time I’m looking at calendar year, and doing the 40 per cent uplift YOY thing to guess Q4 for 2022:

That’s a remarkable increase – and almost certainly explains why so many cities seem to be struggling on accommodation in general and family accommodation specifically.
Countries
It would be helpful to understand which countries are driving the increases in general, and which countries might be driving the dependant increases specifically – because doing so would help a university and their local authority estimate demand for their area based on their own recruitment figures.
This graph from the Home Office was in last week’s piece, and tells a fairly straightforward story:
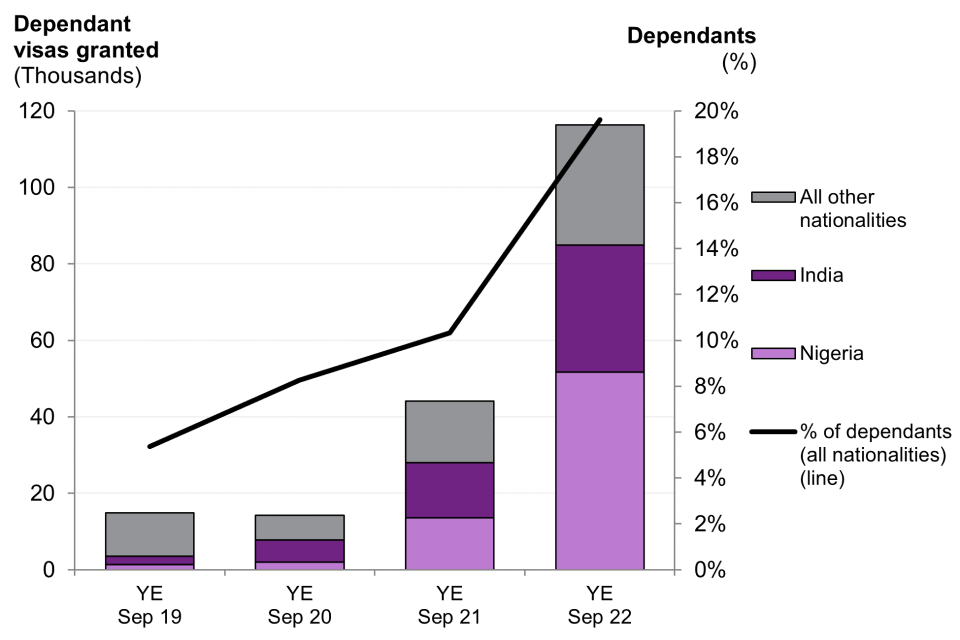
Over time, the number of dependent visas issued per main student student visa has been creeping up without much policy discussion on the implications for universities or for places:
| Students | Dependants | Ratio | |
|---|---|---|---|
| 2018 | 227995 | 12806 | 0.05 |
| 2019 | 268674 | 16047 | 0.05 |
| 2020 | 209827 | 19139 | 0.09 |
| 2021 | 375999 | 54486 | 0.14 |
| 2022 so far | 408331 | 97152 | 0.23 |
And what’s even more remarkable is the difference by country. In 2022 Q3, the rate for Chinese students was 0 if you round to two decimal points. For Nigeria, it was almost 1:1:
| Students | Dependants | Ratio | |
|---|---|---|---|
| Nigeria | 29937 | 27026 | 0.90 |
| India | 77352 | 13473 | 0.17 |
| China | 87396 | 286 | 0.00 |
| Pakistan | 12177 | 2921 | 0.23 |
| Bangladesh | 7065 | 2831 | 0.40 |
Now I know that the above doesn’t even start to look at the rate of those leaving, which does matter – but data on whether students leave or transfer onto other immigration routes is hard to come by. Here’s the “end of August 2019” numbers from ONS whose percentages may, or may not, read across eventually to 2020, 2021, 2022 and 2023:
As you can see, they’re not especially helpful for those that want to make the case that most students leave.
Housing
Are there housing implications? If we look at demand for student accommodation, the problem in a large number of cities in the general private rented sector is now pretty well documented. Supply is going down as people adjust lifestyles post-pandemic, Airbnb looks like an attractive way to sweat an asset and landlords face increased regulation and, crucially, higher mortgage rates.
But don’t most international students live in purpose-built student accommodation? Cushman and Wakefield’s 2022 student accommodation report on the purpose built sector doesn’t even mention family accommodation – but does tell us that in 2021/22, there were 697,734 beds. The problem is the rate of growth.
In 2020/21, 23,935 beds were added to the total. The following year, 24,612 beds were added, and this year C&W reckon that 17,000 new beds have been added to the market.
You don’t need to scroll your mouse much to see that the growth in supply isn’t even getting close to matching the growth in demand – and that’s before you think about the particular needs of particular students in terms of type (ie family) and price point (the students we are now recruiting may not be as rich as in the past, and all are facing much higher costs than anticipated).
Oh – and finally on family accommodation – the media today is awash with stories surrounding the end of the Homes for Ukraine scheme and the inability of families to find suitable accommodation. That pressure isn’t especially well calculated – but at the top level, 104,100 Ukrainians arrived in the UK under the scheme, while another 40,000 came to stay with relatives. That’s a lot of additional pressure on housing on top of everything else I’ve mentioned – which can and should be solved, but won’t be solved as fast as demand is growing.
One of the actual benefits of Brexit (I know, just bear with me) had we an actual government that could see past its own dogma would have been to leverage our world class higher education system to transform the UK into the ‘school of the world’ and actually open ourselves up to a lot more foreign students.
Non-EU students in the EU are limited in most countries to 20 hours supplemental work, nor can they class themselves as self employed to, for example sell things they have made as part of a course.
In the UK such rules would now not need apply and in fact might prove to be easier to integrate given English is a lot more widely spoken than other languages. This influx of foreign students would provide money but also research grants leading to further expansion of these areas.