

Balls, SOCs, chickens, eggs, and graduate jobs
David Kernohan is Deputy Editor of Wonkhe
Tags
Like many this week (most notably a great write-up in the Financial Times by John Burn-Murdoch) I’ve been fascinated by a Harvard Kennedy School paper entitled Tackling the UK’s regional economic inequality: Binding constraints and avenues for policy intervention by Anne Stansbury, Dan Turner, and popular podcaster Ed Balls.
The whole thing is a fun read for fans of economics, productivity, and what we once called levelling up – but the FT’s coverage, and thus my interest, was piqued by a section on regional differences in the graduate premium (the gap between the expected salary of a graduate and their non-graduate peers).
What Balls et al have done is calculate this premium on an (ILTS1: stuff like “south east”, “east midlands”) regional basis. It turns out that the graduate premium is lower and falling outside of London while remaining healthier in the capital. The authors then go on to suggest that this finding indicates that there is no longer a graduate demand gap outside the capital, and that there must be other factors limiting regional growth.
The whole paper is fascinating, but a few points in that bit caught my attention enough to make me break out some data. First up, I don’t like salary as a measure under any circumstance: salaries vary both by region and industry for graduates and the general population (people in London get paid more, so Beavertown Neck Oil is north of six quid for a pint…). So I’m instead using Census 2021 data to look at the proportion of the workforce in SOC groups (as a proxy for graduate jobs), as against the proportion of graduates in a population – and rather than regions I thought I’d look at local authority districts (LADs).
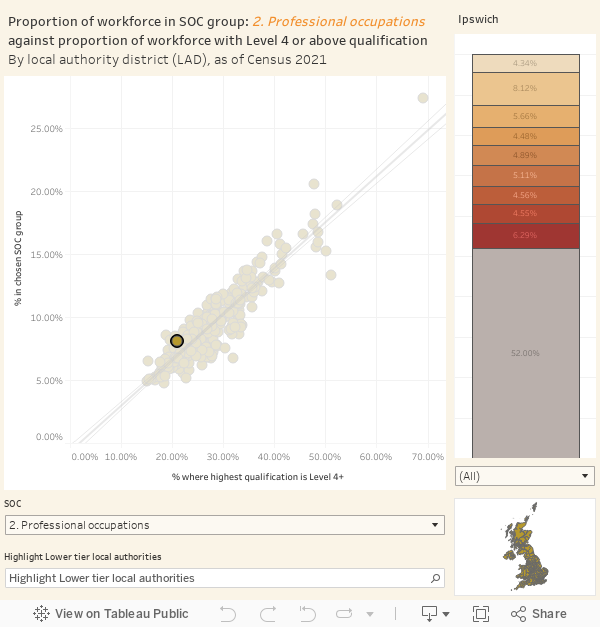
The main scatter plot shows the proportion of people in a local authority district with their highest qualification at L4 or above (graduates) against the proportion of people describing their employment within the SOC group you can change at the bottom. You can search for an area using the highlighter, and clicking on a dot shows you the proportions in each SOC group within each LAD.
What caught my eye here is a really neat correlation between the proportion of graduates in an area and the proportion in a professional occupation (group 2) : r2 is 0.84 for p < 0.0001. In other words the more graduates in an area, the more people will be working in professional jobs.
This neatly illustrates that confusion in causality that I think our paper falls over at: have loads of graduates moved there to get graduate jobs, have loads of professional jobs opened up to take advantage of the availability of skilled workforce, or some combination of the two?
If you think about the perennial “how many graduates do we need?” question – especially in the levelling up terms (that links to the “cold spots” concept – we appear to be at a policy loggerhead between the idea that too many graduates don’t get graduate jobs (so universities are bad), and more graduates mean better opportunities arrive locally (so universities are good).
The tail-offs in the graduate premium spotted by Balls et all could indicate a satiation of local graduate job markets, but could also signify graduates temporarily working “non-graduate” jobs in order to build a sustainable local high-skill economy. Certainly the fact that places that have high proportions of graduates tend to have a low proportion of the workforce in SOC group 8 (process, plant, and machine operatives: r2=0.57 at p>0.0001) suggests that an agglomeration of graduates has some impact on the overall occupational profile.
Anyway, no conclusions here other than that the relationship between high levels of training and highly skilled employment is a complex and fascinating one.
David, Thank you for this extrapolation from the Harvard/ Kings report. I think the relationship between universities’ recruitment patterns and the employment ‘deposits’ of their graduates in their regions is a severely under researched area although crucial in considering ‘levelling up’ factors. Partly this is because the relevent data bases are unhelpful. In our book ‘Universities and Regions:The impact of locality and and region on university governance and strategies’ Shattock and Horvath, Bloomsbury 2023 Ch 3, we compared recruitment data and employment on graduation data for a subset of universities using data supplied by the universities and their definitions of what they defined as their regions. Comparisons, for example, between Leeds and Newcastle Universities and Birmingham City and Lincoln Universites, whose regions all contain substantial areas of economic deprivation, in regard to regionally recruited and regionally employed on graduation point to significant policy issues:
Leeds–14% and 33.7 %
Newcastle–24% and 34.6%
Birmingham City–71% and 71%
Lincoln–76% and 71.3%
Of course there are historical and other issues lying behind these figures but at minimum they prompt the question as to whether the priority given to capital investment in urban centres as a contribution to ‘levelling up’ should not be balanced more proactively with investment in regional human capital.
Mike Shattock
“(people in London get paid more, so Beavertown Neck Oil is north of six quid for a pint…)”
Neck Oil is also north of six quid a pint in Barnsley, where people do not get paid much at all.
There is, however, other beer in Barnsley. Huge areas of central London are Beavertown Neck Oil wastelands.