


This maxim is often cited when high-profile businesses face financial difficulties and possible (or actual) failure.
I googled that phrase to see who originally coined it, but found no definitive answer. I did find the website of a fellow Antipodean, the business guru Greg Savage who, in a few paragraphs explains why cash is the most important factor in successful financial management. His article ends with: “Cash is like oxygen. It’s not what we live for, but if it runs out, you are sure as hell going to notice.”
This is why I and many of my colleagues took a deep breath when we read recent reports of universities “hoarding reserves”. While it’s important to know what the reserves heading on a balance sheet means, and why it’s not an organisational equivalent to household savings, that’s definitely a topic for another article. In this one, I’ll try to explain why cash is something we should all make an effort to understand.
What cash counts?
Although the HE sector as a whole had total reserves of £44.3 billion as at 31 July 2017, there’s a much more accurate measure of “hoarded” cash in accounts: cash-backed reserves. This latter figure for the sector is £2.5billion – just 6% of total reserves. That’s still a lot of money, so I’ll unpack it a bit further.
Cash-backed reserves are the funds that are not already earmarked for specific purposes and are also known as unrestricted cash reserves. A tighter definition would be: cash (typically held in bank accounts) and short-term investments (i.e. they can become cash within a few days), plus or minus the difference between money owed by others and what is owed to others (known as the working capital surplus/deficit).
The resulting figure is a crucial element of financial sustainability. If in times of uncertainty, organisations have no contingency buffer of cash, they have no capacity to weather financial storms. Unfortunately, uncertainty is now rife in higher education: uncertain student demand; uncertain and variable appetites of research funders; uncertainty over the impact of (some kind of) Brexit; uncertainty over the tuition fee loans system; and, uncertainty about government support for struggling institutions.
Here at BUFDG we looked at the figures from 2017 balance sheets of 164 institutions and put the HEIs into four equally-sized groups based on the total level of reserves. The figures quoted are from balance sheets created on one day in the year – in most universities, this is 31st July.
Figure 1: Cash-backed reserves analysis (unrestricted cash reserves)
| Total sector | Top quartile | Second quartile | Third quartile | Bottom quartile | |
|---|---|---|---|---|---|
| £m | £m | £m | £m | £m | |
| Total reserves at 31 July 2017 | 44,279 | 32,130 | 8,163 | 3,123 | 862 |
| % of total reserves | 100% | 73% | 18% | 7% | 2% |
| Unrestricted cash reserves at 31 July 2017 | 2,486 | 1,346 | 706 | 339 | 95 |
| Unrestricted Cash Reserves as a % of Total Reserves | 6% | 4% | 9% | 11% | 11% |
| Unrestricted cash reserves as a % of sector cash-backed reserves | 100% | 54% | 28% | 14% | 4% |
| Unrestricted cash reserves as a % of total reserves | 100.0% | 4.2% | 8.6% | 10.9% | 11.1% |
| Unrestricted cash reserves at 31 July 2016 | 1,617 | 438 | 666 | 344 | 169 |
| Increase in unrestricted cash reserves | 869 | 908 | 39 | (5) | (74) |
| Represented by: | |||||
| Movement in working capital | 291 | 394 | 8 | (61) | (50) |
| Cash generated in the year | 578 | 514 | 31 | 57 | (23) |
| 869 | 908 | 39 | (5) | (74) |
Source: HESA data
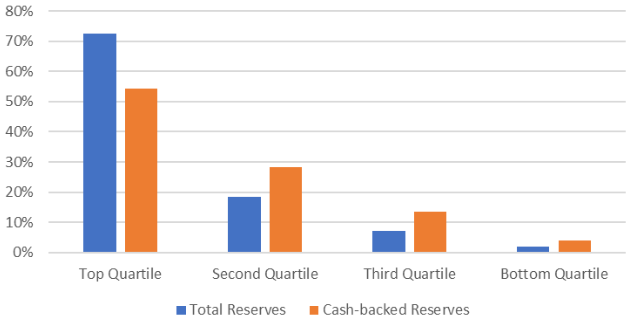
This shows that the top quartile (41 institutions) hold 73% of the sector’s total reserves but only 54% of total cash-backed reserves. By contrast, institutions in the bottom quartile have 2% of total reserves and 4% of cash-backed reserves.
Figure 3: Cash-backed reserves vs total reserves
Source: HESA data
We might at first glance, then, perceive that the institutions with larger reserves are “better off”. But put another way, the institutions in the top quartile have lower cash-backed reserves as a proportion of their total reserves (4.2%) than the bottom quartile institutions do (11.1%). Suggesting that “the sector” is hoarding reserves is plainly wrong because the totals and averages mask a huge level of variation between a highly diverse group of institutions.
Time to change
We can also use these figures to produce another valuable measure of financial sustainability – liquidity.
We determine liquidity by working out how many days’ expenditure the cash-backed reserves represent. In other words, it assesses how resilient an institution is to a fall in its income, by measuring how long it could keep paying its bills for if no other new cash came in. Financial managers learn that best practice is to maintain at least 35 days’ worth of expenditure as liquid assets. This might still seem overly-cautious, as we know that income doesn’t suddenly stop completely. However, this buffer is essential if institutions are to spot the trends that might lead to a reduction in income, and then have the financial breathing space to come up with, and then implement, the changes necessary to keep ensuring long-term sustainability.
We took HEIs’ total expenditure and deducted depreciation, as this is an accounting transaction rather than one that involves cash movement. Then we looked at the number of days the cash-backed reserves would last against this expenditure.
Figure 3: Liquidity days
| Total sector | Top quartile | Second quartile | Third quartile | Bottom quartile | |
|---|---|---|---|---|---|
| Cash-backed reserves | 28.18 | 26.20 | 36.64 | 26.42 | 20.10 |
Source: HESA data
Apart from the second quartile HEIs (and even then, only just), the sector as a whole and the groups we have carved out do not meet the 35-days measure. Fourth-quartile institutions held only 20 days of free cash which, by this measure, demonstrates the challenging liquidity environment they operate in.
Understanding cash-backed reserves is vital when considering the amount of cash that universities are holding, or should hold, and what that cash can be used for. The sector is, despite the huge figures quoted, struggling to generate sufficient cash from operations to invest in people, research equipment, and buildings. But borrowing must be repaid using cash, which brings us back to why it is important to realise that, like oxygen and cash, we are sure as hell going to notice if the amazing discoveries and educated people that universities create run out.


Useful article though the BUFDG analysis takes a narrower view of liquidity than HEFCE did in their “Financial Health of the Higher Education Sector 2016-17” report in which they said the (English) university sector had “net liquidity of £10.4 billion, equivalent to 140 day’s expenditure”. I guess it depends how accessibe the cash is.but there are choices being made which determine where universities are. The HEFCE report says that total (English) university capital expenditure rose to £4 bllion in 2016-17 with £1.7 billion of this being funded from internally generated cash reserves. The English college sector (where I work) has been forced by financial pressure to cut back capital expenditure – to less than £500 million in 2016-17, none of which is funded from internally generated cash because there isn’t any
Excellent article, enjoyed reading it. Working closely with my old Director of Finance made me realise the importance of cash generated through operations and he used the very phrase you use in your title. Look forward to more.
Interesting article, thank you. My institution carries somewhere between 25 and 35 days of free cash liquidity. However, it has investment reserves that are callable quite quickly (3-day liquidity subject to Trustee approval), so I wonder how much of the reported sector reserves are illiquid fixed assets and intangibles and how much are semi-current assets that happen to sit in the Fixed Assets category on the top half of the Balance Sheet?
Thank you for your observations. Our view of liquidity is indeed narrower than that of the HEFCE / HESA definition (please see https://www.hesa.ac.uk/collection/c15031/key_financial_indicators ) in that we have not included Investments. This is on the basis that we have assumed they can relate to endowments, so by their very nature have restrictions as to their use, and therefore do not represent free cash.