In 2021 terms, TRAC is an anomaly. It is regulatory data that is prepared on a UK basis with all five funding/regulatory bodies (OfS, HEFCW, SFC, DoE(NI), UKRI) taking some interest in the results.
The 2019-20 version, out now, covers the first chunk of the pandemic – and there were consequent tweaks to the submission timeline as a result of this. We don’t (yet) get a look at annex 1.1b (that deals with adjustments made as a result of Covid) – this will be released “shortly”, we are told.
Making TRACs
For the uninitiated, TRAC stands for “TRansparent Approach to Costing”. It deals with the calculation of the total (direct and indirect) costs to carry out a range of common activities in a higher education provider (teaching, research…) and is most commonly used to compare these costs with income as a result of these activities.
Financial data from your provider (on expenditure and income) is used alongside a range of other inputs – academic staff time allocation, data on space utilisation weighted by type, and staff and student numbers. TRAC also includes a margin for sustainability and investment (MSI) as a part of the calculation of expenditure – this is worked out for each provider using a standard methodology (see annex 3.2a of the guidance), and comes out on average somewhere around 8 per cent of total expenditure.
If you think back to the Augar Review you might recall that MSI became hugely controversial – the story is long and complex, but in essence the panel decided that they could (a) arbitrarily decide that it is always 10 per cent, and then (b) ignore it as a cost, because who needs sustainable providers of higher education? This was the actual argument made in support of the push for £7,500 fees, and thankfully the idea seems to have died a death.
Peer review
On average, providers recoup 95.8 per cent of the cost of publicly funded teaching – the median is 95.2 per cent. At current fee level and additional support rates, this means that providers are just under breakeven for public funds.
Given that there are four radically diverging systems of higher education teaching funding in the UK, it would be very interesting to see the differences by nation. We don’t get to look at that – but (uniquely in TRAC) we do get a view by UK peer groups, which are derived from 2012-13 financial data(!) as follows:
- Peer group A: Institutions with a medical school and research income (that’s funding council recurrent research grant plus total research grants and contracts) of 20 per cent or more of total income
- Peer group B: All other institutions with research income of 15 per cent or more of total income
- Peer group C: Institutions with a research income of between 5 and 15 per cent of total income
- Peer group D: Institutions with a research income less than 5 per cent of total income and total income greater than £150M
- Peer group E: Institutions with a research income less than 5 per cent of total income and total income less than or equal to £150M
- Peer group F: Specialist music/arts teaching institutions
If you’re not fancying downloading historic finance data to figure this out, there’s a list of which providers each group contains, and I’ve plotted it for you here:
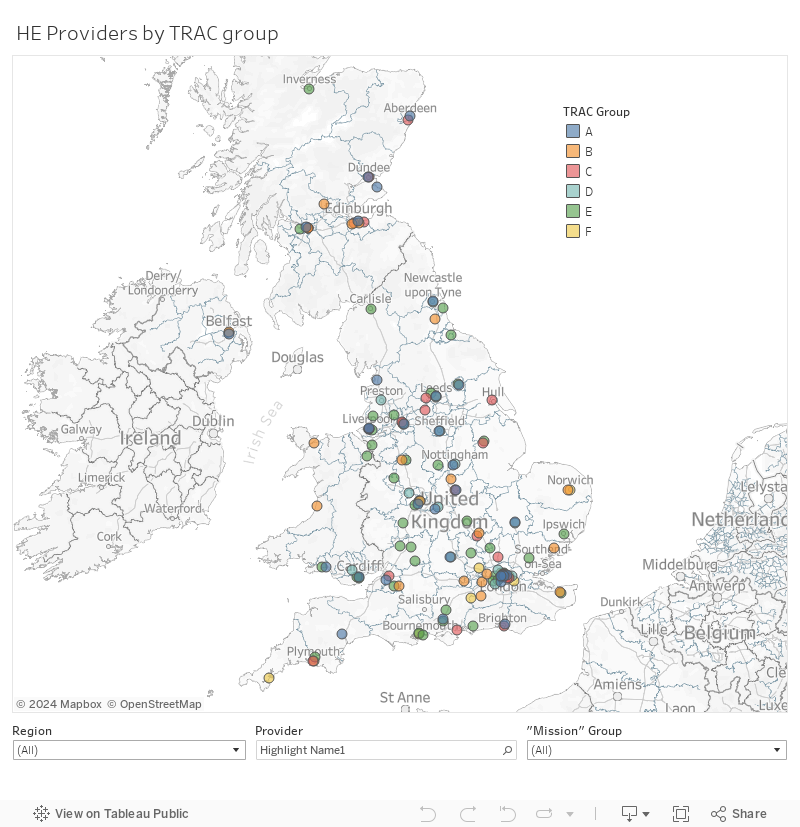
In essence: the Russell Group is in group A – with the exception of the University of Durham which ends up in group B alongside a bunch of other non-medical school pre-92 universities. The remaining handful of large pre-92s are in group C – and everybody else is in groups C, D and E, with group F being self-explanatory. As only a handful of alternative providers submitted finance data to HESA in 2012-13, most are not shown.
Group differentiation
As can plainly be seen, these groups (as arbitrary as the grouping may seem from a 2021 perspective) have had different experiences when it comes to cost recovery.
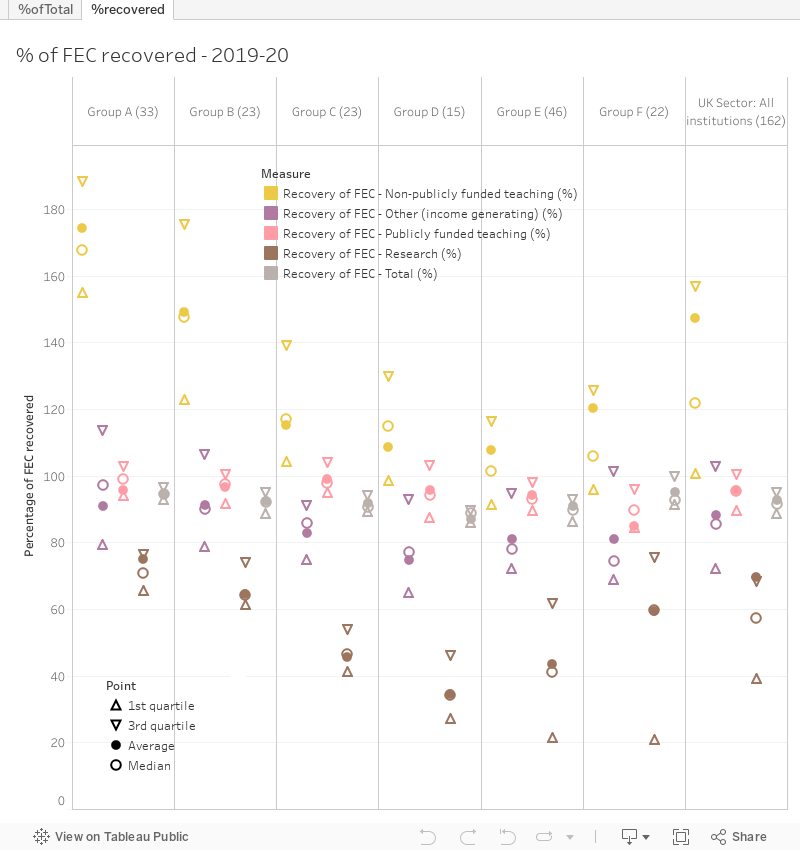
One notable “covid age” artefact here is the failure of “other (income generating)” activity to recoup costs. This refers to stuff like conferencing, residences, and on campus catering and related facilities. Clearly this is not a sustainable approach, and though it is well out of line with the small profit returned in 18-19 it is likely to repeat itself for 2020-21 – costs (in covid safety measures) will rise and income (given the inability to use the facilities for much of the year) will fall.
Otherwise the headlines are a repeat of other years – non-public funded teaching brings in much more than it costs to deliver, research costs more to deliver than it brings in, and in total running a university during 2019-20 was not a great way to make money.
It stands out to me that research recovery declines along with the volume of research income, and that this runs largely in parallel with the proportion of additional income realised from non-public teaching. But the big story given recent changes in England is that specialist music and arts providers already recoup less of their costs in delivering public teaching than any other part of the sector – the mean is less than 85 per cent, underlying the sheer pain that a cut to additional strategic funding will cause.
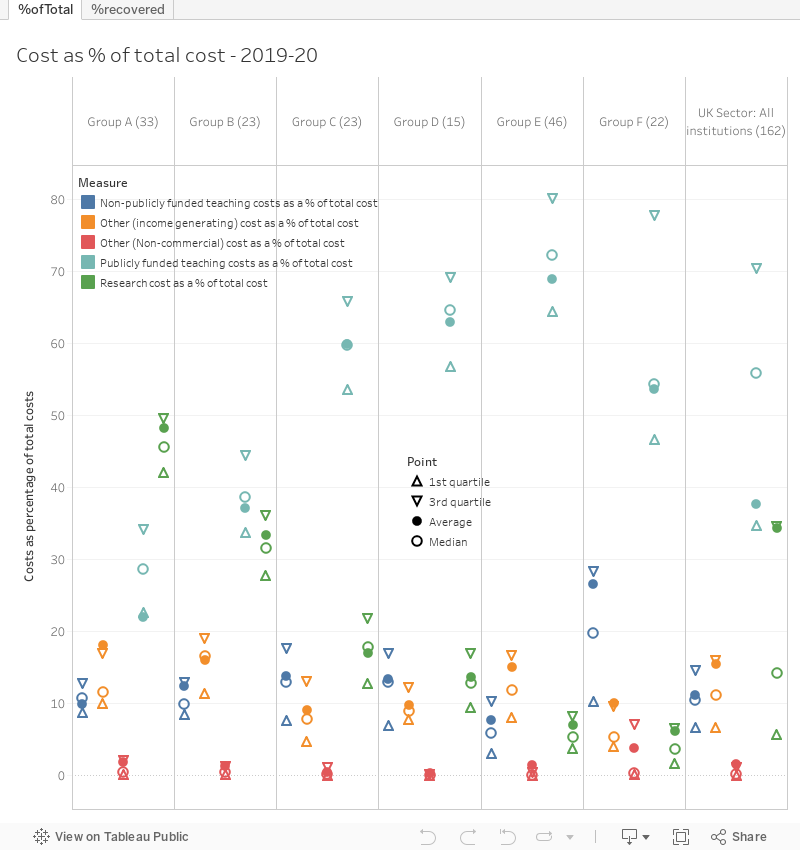
In proportion
There’s also an indication of the proportion of total expenditure incurred towards each of our categories, by group. Nearly half of group A spending is dedicated to research, whereas in the larger teaching focused providers of groups C and D publicly funded teaching represents around 60 per cent of spending. Group B is the most balanced between these two activities.
Moving forward
There were a lot of assumptions around the time of Augar that providers were systematically misreporting TRAC in order to make provision look more expensive than it really was. It’s not often we see a full-blown conspiracy theory in higher education policy, but it is worth breaking down why this is very, very, unlikely to be the case:
- TRAC is zero sum. As all spending (other than the MSI) is allocated to one of these five pots, a worse return for public teaching would mean a consequently better return somewhere else. As the sector is diverse, an advantageous shift for some providers would cancel out an advantageous shift elsewhere. It is emphatically not “time for some game theory”, as game theory here suggests a steady state.
- Even if a single provider reports higher costs for teaching than expected, these costs are not made up directly. TRAC does affect the precise premium paid per high-cost student, but for the whole sector.
- If there somehow were an advantage to the whole sector misreporting in a given way, have you ever tried to get 160+ senior institutional managers to agree on anything?
- In 30 years of running TRAC, such behavior has never been seen, and the chances of even one provider sustaining a secret plan to misreport expenditure in TRAC for that length of time are impossible.
- Honestly, most providers find it hard enough to get TRAC right as it is. Getting it right and then tweaking it in a way that flies under the radar is a bridge too far.