


How does higher education contribute to political divisions in the UK?
As my colleague Jim Dickinson argues, HE is both an opportunity that helps people get the opportunity to live the lives they want and a means of separating them from their background. A referendum and an election have shared to highlight this – and have seen MPs develop an interest in the views of “ordinary people”. Higher education, it turns out, is a touchstone that polarises people – our national relationship with academia is more complex than we may care to admit.
But how do we measure how people have been exposed to or engaged with HE – and how do we use these measurements to examine voting patterns?
With the UK parliamentary constituency as my unit, I’ve chosen three variables that might offer us a glimpse of how each part of the UK has engaged with HE.
The data
POLAR4 is the one you might be most familiar with – a measure of the rate of young participation in HE. POLAR was developed by Mark Corver (now of DataHE) when he was at HEFCE, and the Office for Students now owns the dataset. The measure is traditionally shown as five quintiles, with quintile 1 representing those areas with lowest rates of participation in HE. POLAR4 is usually calculated for Mid-level Super Output Areas – I’m grateful to ONS for helping me come up with a constituency variant, though all errors are my own.
Application rates comes from the UCAS release of application numbers by their 15 January deadline – which is made available by constituency each year. There’s a time series right back to 2008.
Number of institutions and FTE staff/students as % of voters are two troublesome data points of my own – both drawn from my new-found ability to map institutions to constituencies via postcodes. Expressing the FTE for staff and students as a percentage of the constituency electorate does not imply all of these people vote in this constituency – you could see it more as the number of “HE people” you might find in the constituency on a given weekday. Clearly some, but not all, will reside in the constituency – but a transitory population of a significant size may have an impact on the character of an area. This data is derived from what is available from HESA – but is my fault, not theirs – and FTE for staff and students is taken from the most recent figures available in each case.
For general political information, the House of Commons Library has some great data from the 2017 election, and the constituency estimates for the percentage Leave vote in 2016 is taken from the work of Chris Hanretty. Constituency boundaries are from the very handy tableaumapping.bi.
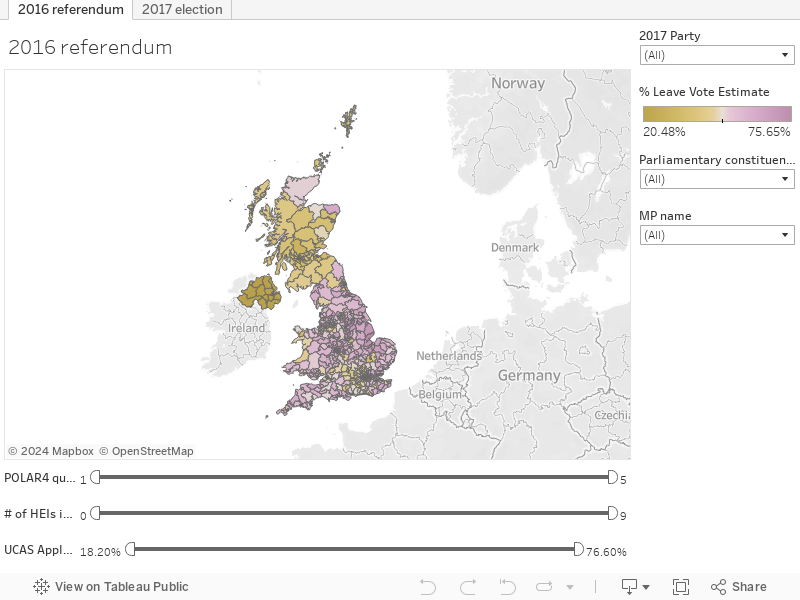
In the maps above you can use the three sliders at the bottom to filter the visualisations by the number of institutions, POLAR4 quintile, and application rates – setting minimum and maximum values. You can also use the filters to find constituencies (and MPs) of interest, and there’s also a filter by the political party that held the constituency after the 2017 election.
What it shows us – Brexit
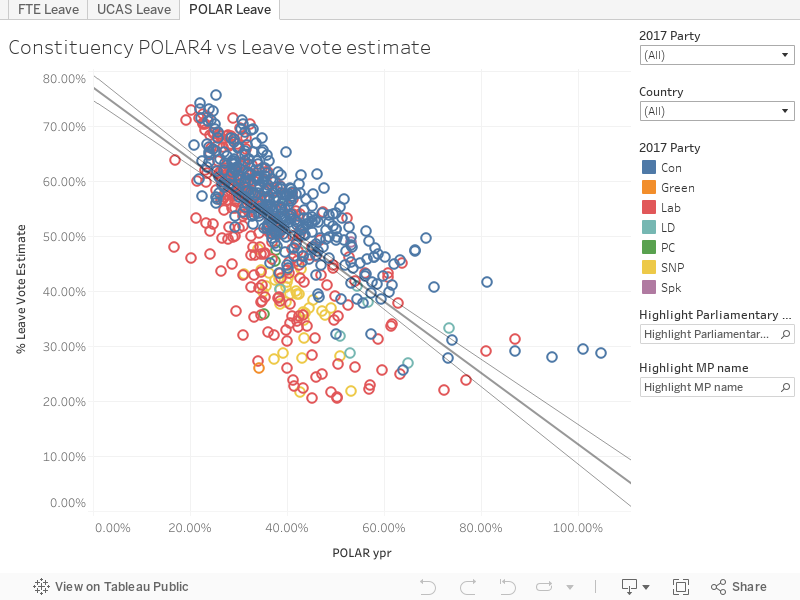
The young participation rates that underpin POLAR4 are the best of my three measures for predicting the likelihood of a constituency voting leave – with a reasonable correlation between constituencies with a high participation rate and constituencies with a low leave vote estimate.
UCAS applications show a similar but less pronounced pattern for 2019, and even going back to 2016 or earlier only shows a vague relationship. There’s very little correlation between HE people as a percentage of the electorate and the Brexit vote – here I’ve plotted only those constituencies with one or more large providers.
A high application rate is of course an indicator of an affluent neighbourhood. This effect is more reliable at the smaller (MSOA) scale, but it still works for constituencies, although less well-off parts of affluent constituencies may be hidden at this scale.
But I’m surprised by the lack of a relationship between the population linked to HE and a Brexit vote – I suspect that our “Remain by default” perception is down to a small group of very vocal academic staff – and I’d love to see a more detailed survey taking in all staff.
What it shows us – 2017 elections
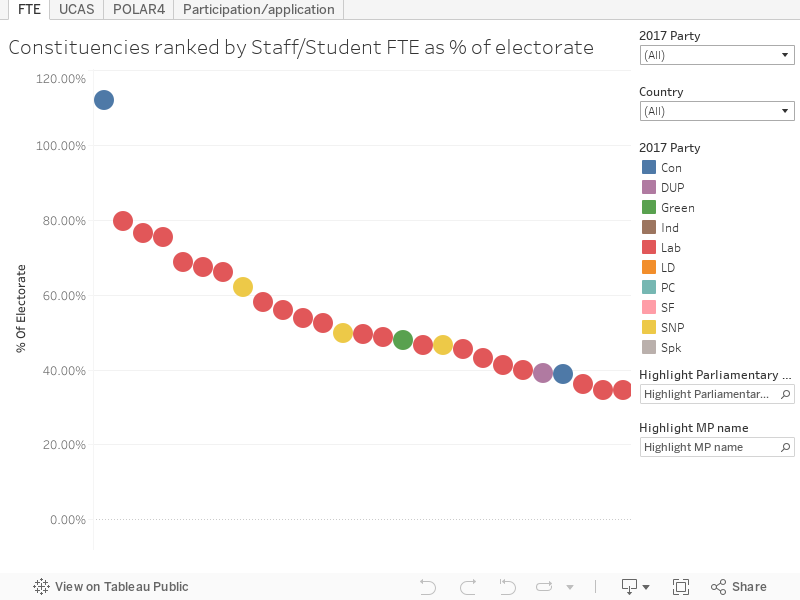
In contrast – FTE as a % of the electorate is a fascinatingly good predictor of the winning party – only one of the top 20 on this measure elected Conservative (and that was the notable outlier of the City of London and Westminster, which curiously has a HE population larger than it’s actual electorate!)
In the next ten constituencies, we find only Filton and Bradley Stoke (UWE) and Welwyn Hatfield (Hertfordshire) voting Conservative – each has a lowish majority and would certainly be worth watching come the next election.
In comparison POLAR and application rates do not really seem to have much of a bearing on the winning party, surprising given the close relationship with Remain and Leave voting. What this suggests to me is that the 2016 referendum was a much more existential question, prompting deeper reflection, than a parliamentary election typically would.
There are numerous stories we can tell around why this might be the case. But why does participation in HE by young people from a constituency link to a Remain vote? And why does the presence of a lot of students and staff in a constituency link to a Labour, SNP, or Green vote? We don’t claim to have the answers to these questions – but the relationship between HE and political behaviour is clearly more complicated than is generally thought.


“And why does the presence of a lot of students and staff in a constituency links to a Labour, SNP, or Green vote?”
Urban constituencies are much more likely to vote for Labour (or recently, SNP in Scotland) because of a wide range of social factors. Urban constituencies are also much more likely to contain universities (and especially to contain more than one university) because it makes sense to build them where there’s a high population density. So I’d guess no particular direct correlation.
I am sceptical about the applicability of this data to Scotland for three reasons.
Firstly, while POLAR4 has been used to calculate participation rates by the OfS, desperate to assert its applicability on a UK basis, this is not necessarily on a nation comparability basis due to the differences between the English and Scottish education system both at transfer age/length of degree programmes and due to the high level of staying on/participation in HNC/D qualifications in Scottish Colleges (according to the POLAR documents around one third of HE in Scotland is in Colleges, compared to one twentieth in England; the Scottish Colleges are often incorrectly labelled as “FE” south of the border as if they are comparable to the ostensibly similar post-16 institutions in England, when much of their work is actually at HE level on the EWNI FHEQ). The Scottish Colleges (quite rightly) do not use UCAS for transfer between School and College and between Colleges at HNC level, and any data using UCAS is therefore spurious at aggregate Scottish levels. For various reasons, Scottish institutions and bodies use SIMD20/SIMD40 calculations, not POLAR, as this calculation is more applicable as a measure of WP in the Scottish context.
Secondly, the geography of Scottish University-level institutions is rather different to that in England, as at least 3 of the 18 HEIs are genuine multi-campus institutions with substantial distances between campuses (UWS, SRUC and UHI). This is ignoring the Open University. Taken together these widely spread multi campus institutions constitute some 10% of full time UG student numbers in Scotland, and probably a similar/higher proportion of staff. Therefore to attempt to map these institutions onto constituency level data based on the postal address of the ‘main’ campus for administrative purposes is not very accurate. It’s also fairly dubious for commuter campuses such as QMU and HWU.. One third of HE students are in any case to be found in Colleges (and the majority of these are also multi-campus). Scottish students as a whole have a much higher propensity to ‘stay at home’ and therefore commute to their campus rather than as in England live ‘boarding-school’ style in close vicinity to the institutions.
I think there will be some similar issues affecting the data for London campuses in the English data (including of course the growth of satellite campuses of those outside London which may be small for any individual institution but mount up across the whole HE patch).
Finally and perhaps most significantly, the factor that motivated such a larger proportion of the Scottish electorate to vote to Remain in the EU is of course very different to the reason in England that led to a Leave vote. While I am sure that education and age do have a (small) impact in Scotland, the overwhelmingly important factor is a much more positive approach to immigration across the whole of the population, a political dynamic that is still very much in play in the dog days of the current Brexit negotiations and have led to an increasing separation of the two countries in political outlook and direction.
Therefore it would not surprise me in the slightest to find that in Scotland there is no (or a tiny) statistically significant correlation between these measures of level/impact of University activity and the distribution of either students or staff locality, and the propensity of a particular electoral area to have a higher or lower level of majority Remain vote (given every single local authority area and constituency area voted that way).
Interesting, but how do you get only 1 HE institution in Holborn and St Pancras ? As well as UCL it contains Birkbeck, RVC, SOAS, LSHTM. Several universities will have bits in more than one constituency so the RVC may be elsewhere but the other 3 are solely in Holborn
City of Westminster and London is no surprise. Its working population I would expect to be many tens of the size of its resident ie constituency population. Like the workers few if any of the students and HE staff will live there and so be able to vote.
Birkbeck has a significant campus in Stratford – Parliamentary Constituency West Ham. SOAS used to have a campus in Islington South and Finsbury constituency. May have something to do with it?
Like I said, assuming that constituency and institution(s) have the same degree of relationship MIGHT largely work where you have residential campus universities in a single geographically spread constituency, eg for the likes of Cambridge, Oxford West & Abingdon, Canterbury, Lancaster & Fleetwood, Stirling, Liverpool Riverside etc … but it falls apart in London and large chunks of other cities … and most of Scotland.