


I’d very much like to buy whoever it was in the Office for Students who decided that TEF4 metrics data should be released to the public in early January a drink.
You’ll recall last year, and the year before, Wonkhe has spent “TEF day” (late June) diving deep into the underpinning data to make sense of what has happened and why. Last year I had a go at running TEF3 under TEF2 rules the night before, to give people an idea of what to expect – but it was a lot of hard work just to be called out for supposedly making a “schoolboy error” by Chris Husbands. (I didn’t, for the record – I just didn’t have all the data I needed to model the latter stages of assessment).
Now – with vast swathes of data made available earlier in the year – we get to do a large chunk of analysis in early January. It’s not perfect – the data covers English entrants only, and all eligible institutions not those who will definitely enter – but it allows us to run at least the very first part of the process and take a sneaky look as to what their results might look like.
Initial hypotheses
In all, of 320 eligible institutions, 31 have a Gold initial hypothesis (based on part 1a of the process), 198 a Silver, and 91 a Bronze – a far lower proportion of Gold awards than previous TEF iterations. Please not that these are not “predictions”, this is just the starting point on which the TEF panel will work their magic.
First up, here’s the overall change between the new initial hypotheses and the TEF awards that institutions currently hold.
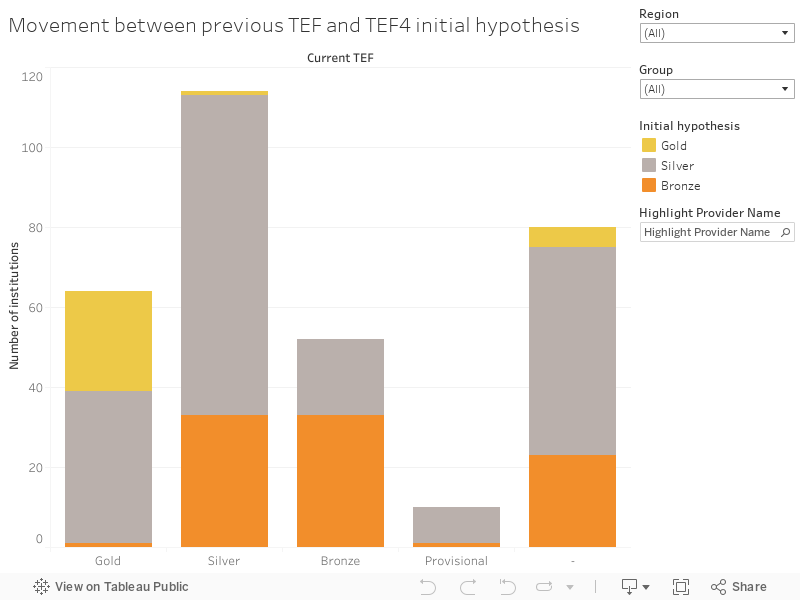
Your first thought may well be “Wow, that’s a lot fewer Gold TEF awards”, and you’d be right. Of the English institutions eligible to become involved in TEF4, the initial hypotheses suggest a lot less Gold awards would be handed out. Notably not one single Russell Group institution sees a Gold award.
On the visualisation you can use the highlighter box to look for any institution you are interested in, and or use the group and regional filters to take a look across your preferred cut of the sector.
I’ve also build a more detailed look-up on an institutional basis.

Use the box at the bottom to choose your institution.
Yet more fun with flags
The way TEF4 awards will been generated doesn’t differ vastly from the TEF3 methodology. This makes the two comparable – TEF2 and TEF3 were not. The first stage sees the calculation of an initial hypothesis, based entirely on the core metrics for the dominant mode of provision (full- or part-time). Each of the core metrics is compared to a benchmark, and a significance flag is generated, showing the importance of the difference between the two.
These flags are displayed in the data as double positive (++) through to double negative (- -). The use of this gradation is frequently criticised as it did not cut the statistical mustard – a single significance flag in the sector key performance indicators is equivalent to a double flag for TEF – which makes the TEF single significance flag not especially, erm, significant.
These days single and double flags are treated the same for the purposes of calculating the hypothesis – but the six core metrics are not. The NSS derived metrics – for teaching, academic support, and assessment/feedback – are weighted at half that of the other metrics.
So the formula (as set out by DfE, paragraph 7.11) goes as follows
Positive flags on metrics worth 2.5 or more, and no negative flags – Gold
Negative flags on metrics worth 1.5 or more – Bronze
Otherwise – Silver
This gets us to our initial hypothesis – step 1a of the TEF assessment process. And I’ll add one little caveat – institutions with similar numbers of full and part time students will have a 1a calculated both modes of delivery, whereas I’ve just done the one indicated as the primary mode by OfS.
What happens next
In some cases nothing – if the initial hypothesis is looking clear cut at this stage it is unlikely the award will change (paragraph 7.13 in the document above). Otherwise we move onto step 1b, which looks at these initial hypothesis in terms of absolute values and split metrics.
Beyond this, step 2 brings in factors that could affect performances against core and split metrics – the supplementary metrics and anything relevant in the provider statement. The three supplementary metrics are grade inflation (which I looked at last month) and two metrics derived from LEO, which I plot here.
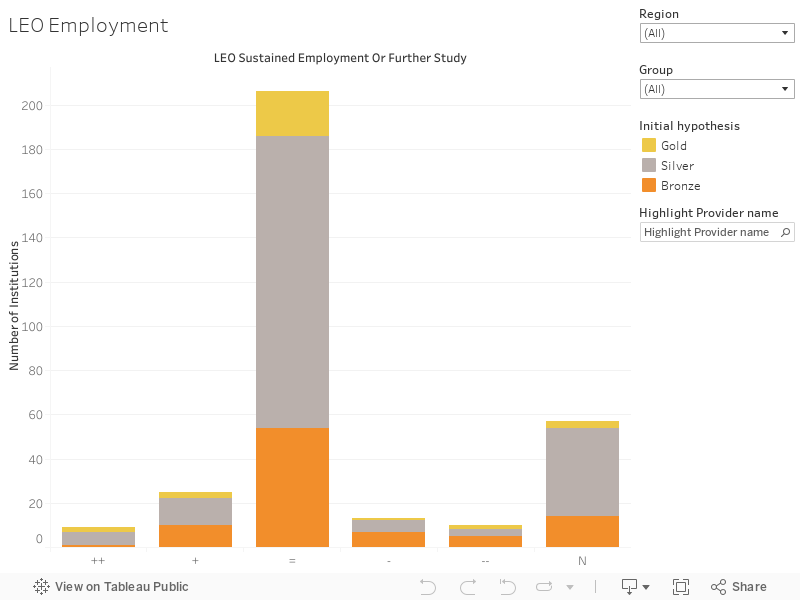
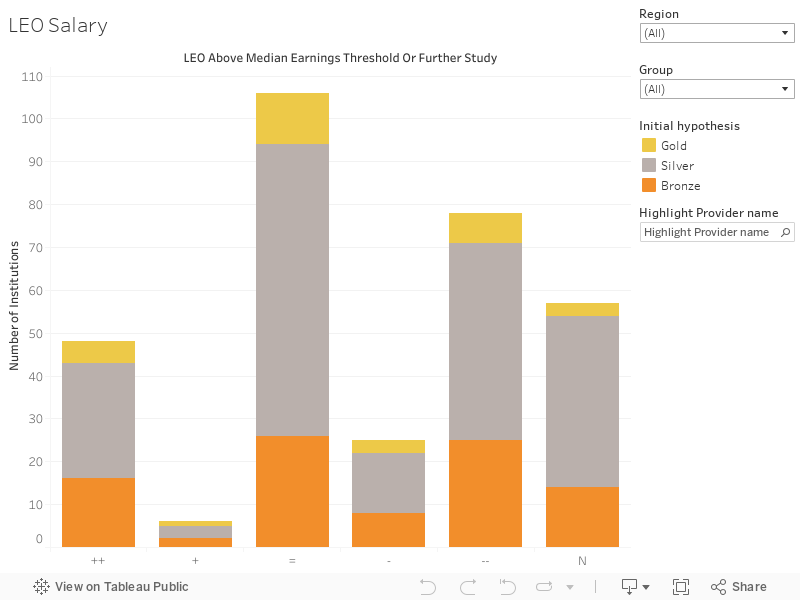
These two graphs work in the same way as the overall change graph – but I’ve included the two DLHE-derived measures in the tooltip as these are the ones most likely to be affected.
I’ve always been suspicious of the utility of the provider statements – but a failure to submit any substantive additional evidence in the statement now means metrics are assessed much more harshly. So even if your metrics are looking great, an insubstantial statement could see you awarded Bronze for as much as one negative flag in any core, split, or LEO supplementary metric. It looks like this is being done to address the issue of people submitting statements that say “Our metrics look like a Gold, so we’ll have that – thank you” as memorably happened in one instance during TEF2.
Finally, Step 3 is the holistic judgement – a final check that the awards look right against the descriptions of each award level (paragraph 7.71).
So?
This data will be a huge help to institutions in planning their statements – for the entire of the week they have left to submit before the 17 January deadline. They’ve had their own data since October – but this will be the first sight they’ll have of the metrics for comparator institutions. But after then, assuming no verification queries arise, it’s the long wait til early June.
If they choose to enter the competition, that is. Existing awards will be rolled over for an extra year to allow time to build a subject TEF driven system, and/or respond to the conclusions of the statutory review of TEF. Institutions holding Gold awards may choose to stick rather than twist at this point.
There’s a lot of other data there – and a lot to play with over the coming weeks. A little taste of June busting out all over the cold days of January.
Not doing 1(b) – and therefore not including the generation of positive and negative flags from being in the top/bottom 10% (with no negatives in the split for top ten %) – underestimates the number of Golds though? Generating flags from * means that there will be more Gold (including RG Golds, e.g. York).
Have you looked at TEF 2 metrics hypotheses vs TEF 4 metrics hypotheses?
Andy – no you can’t run 1(b) with just the data as it involves human judgement.
David – no, I’ve not, but that would be very interesting. I wish we had the full set of TEF3 data for eligible institutions as that would also be instructive.
David: Sure, the aspects of 1(b) which involve interpretation involve human judgement, but the first step of 1(b) is pretty much the application of an unambiguous algorithm, e.g. “In interpreting a very high absolute value, panellists and assessors should … If the metric is unflagged, and does not have negative flags in any of its split metrics, a star should be considered in a similar way to a positive flag in determining the final position of the initial hypothesis” (cf. 7.17 of the Technical Specification).
I realise that the rest of 1(b) can’t be done (and in theory 1(b) is multiple things done concurrently), but the absolute scores still fundamentally change the initial hypothesis is an automated manner.
I’d endorse what Andy says wholeheartedly- the failure to carry out the algorithmic element of 1(b) means the analysis in the article is fundamentally flawed.
Hi Richard, Andy. I don’t think it is fundamentally flawed – bit harsh perhaps? I’ve done what I set out to do which is to model the first part of the assessment process (& the only one which can be modelled entirely using data). Although a stab at modelling a portion of part 1(b) may flatter some institutions a little to me it makes no sense as:
i) – the algorithm Andy cites isn’t unambiguous or indeed an algorithm. Anything that starts with “In interpreting…” is going to require interpretation, and the whole of that section of the Technical Specification is set out as guidance to assessors
ii) – absolute values is a small part of a documented stage, not a whole stage. Modelling part 1(a) and a little bit of 1(b) just looks silly. Also consider paras 7.13-7.14 – that kind of academic judgement is not modellable.
Now, I’m deeply sorry that your institutional core metrics don’t look great, but calling a presentation of those core metrics “fundamentally flawed” isn’t a great look. The metrics exist, they form the starting point of the TEF, and I’ve presented them.
Would it be possible to include Welsh HEI’s in this analysis. Although not compulsory most Welsh HEI’s are voluntary members of the TEF club.
Hey EntEdFred – it would be lovely to, but OfS have only released data for eligible English providers.
Hi David, if an English provider isn’t on the list but expects to be, what would the reason(s) be?
It could mean that OfS have deemed you ineligible, or you don’t have enough one or more of the six core metrics for it to be represented on that data, or data from one of the six metrics has been suppressed in one of the six core metrics (usually for reasons of low N).
Thank you!
Hi David – For what it’s worth, although I was and am still writing in a personal capacity, I am happy to confirm that my institution’s (starting point) initial hypothesis would be unchanged by the inclusion of the additional step I suggested.
My point wasn’t about “flattering” some institutions; it was about the fact that some institutions’ initial hypotheses will change, and we know they will change and how they will change (because this change *is* algorithmic, the guidance states that absolutes “should be considered”, directly mirroring the language used in the part 1(a) of the process).
Your decision not to include all of the available evidence when conducting the analysis is your decision. But it looks likely to underestimate the number of Gold awards (and potentially the number of Bronze awards) suggested by the initial hypothesis (which is a two-part process, of which 1(a) is only the starting point), which would undermine one of the key points in the article:
“Your first thought may well be “Wow, that’s a lot fewer Gold TEF awards”, and you’d be right. Of the English institutions eligible to become involved in TEF4, the initial hypotheses suggest a lot less Gold awards would be handed out.”
I think you’d have a better predictive model if you used all of the available data. You’ve already explained that you think this would look silly, but then I’d consider prefacing ‘initial hypothesis’ with ‘(starting point)’, and at least change that last ‘would’ to a ‘might’.
Hi, I am responsible for the TEF submission at Loughborough College and the flags that you are displaying for our Yr4 core metrics are wrong. Why might this be please?
Hi Chris – as stated in the article I’ve displayed the core metrics for your majority mode of provision (column F of the data matching the value in column C of the data). I’ve just rechecked this with a freshly downloaded OfS spreadsheet and the data in the visualisation is correct.
Is it possible you are looking at your part-time core metrics?
Hi David, my apologies – I think I have been confused by your use of = to represent no flag. I took this as double negative. Assuming this is the case, the information is correct. Would it be less confusing if you left a blank here in the same way that the metrics are presented to providers?…..or is it just me?!
Hi Andy, now that the TEF year 4 data is available for the other UK home nations, would it be possible to add the relevant institutions in to the list? I’m trying to do a report on Year 4 performance for RGU so it would be a huge help for me!