


On first glance, the results of this year’s HEPI/Advance HE Student Academic Experience Survey are a cause for minor celebration.
Value for money positivity is up, more students are saying that their experience matched or exceeded their expectations, numbers of students considering leaving are down, and ratings for satisfaction with both teaching and assessment have improved too – despite last year’s strikes and marking and assessment boycott.
On the other hand, more than half of full-time students are working part-time, spending on average nearly two days a week doing so, and when combined with time spent on study, students with jobs are averaging 48-hours working and studying – far more than the 36.6 hours that the Office for National Statistics says adults are working for in the population in general.
Peek beneath the bonnet a bit – and set aside the Covid noise that tends to show up in all sorts of improvements these days – and you get an even more disturbing picture, which if anything shows an even more intense bifurcation of different student experiences than we started to see last year.
The SAES, now in its nineteenth year, is a big bit of work – 10,319 full-time undergraduates from across the UK responded between January and March of this year. This year’s sample, for some reason, is significantly older, and more likely to be at alternative providers than previous waves – and they’re more straight and less LGB+. But we’re assured that weightings have been appropriately applied for gender identity, ethnicity, year of study, domicile and type of school attended.
Here we’ve pulled out many of the toplines from the report, as well as plenty you won’t find in the narrative that are hiding in the data tables. Big thanks as ever to DK for the tableaus.
Getting your money’s worth
The first bit of good headline news is on VFM. The survey has been asking about course “value for money” for some time – and this year the scores have continued to bounce back:
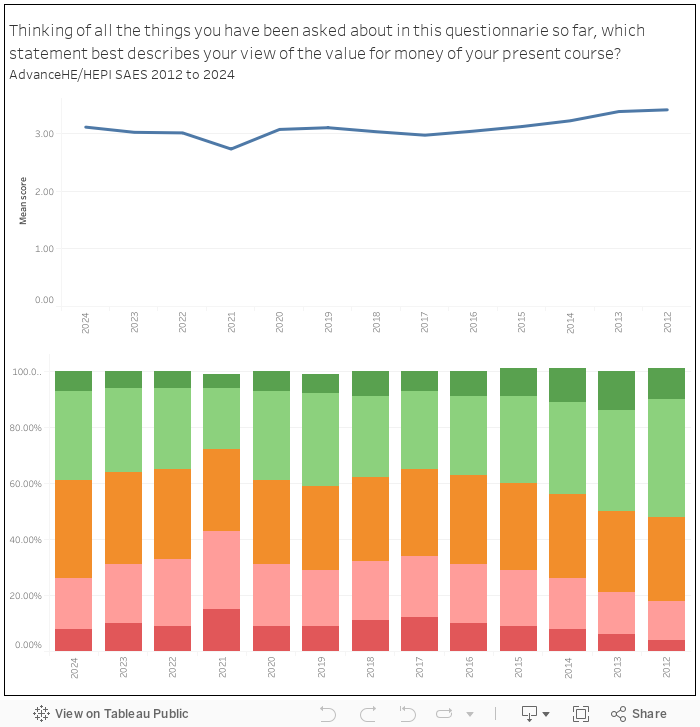
The report says that 39 per cent means that positivity is back up to pre-Covid levels, although the report says the uptick isn’t statistically significant – as we noted at the time, when you looked at who’d been surveyed in 2020 before Covid kicked off, good or very good value for money was reported by 40 per cent of respondents. 2019’s 41 per cent was arguably the high benchmark – and so anything that still hovers around it remains pretty woeful.
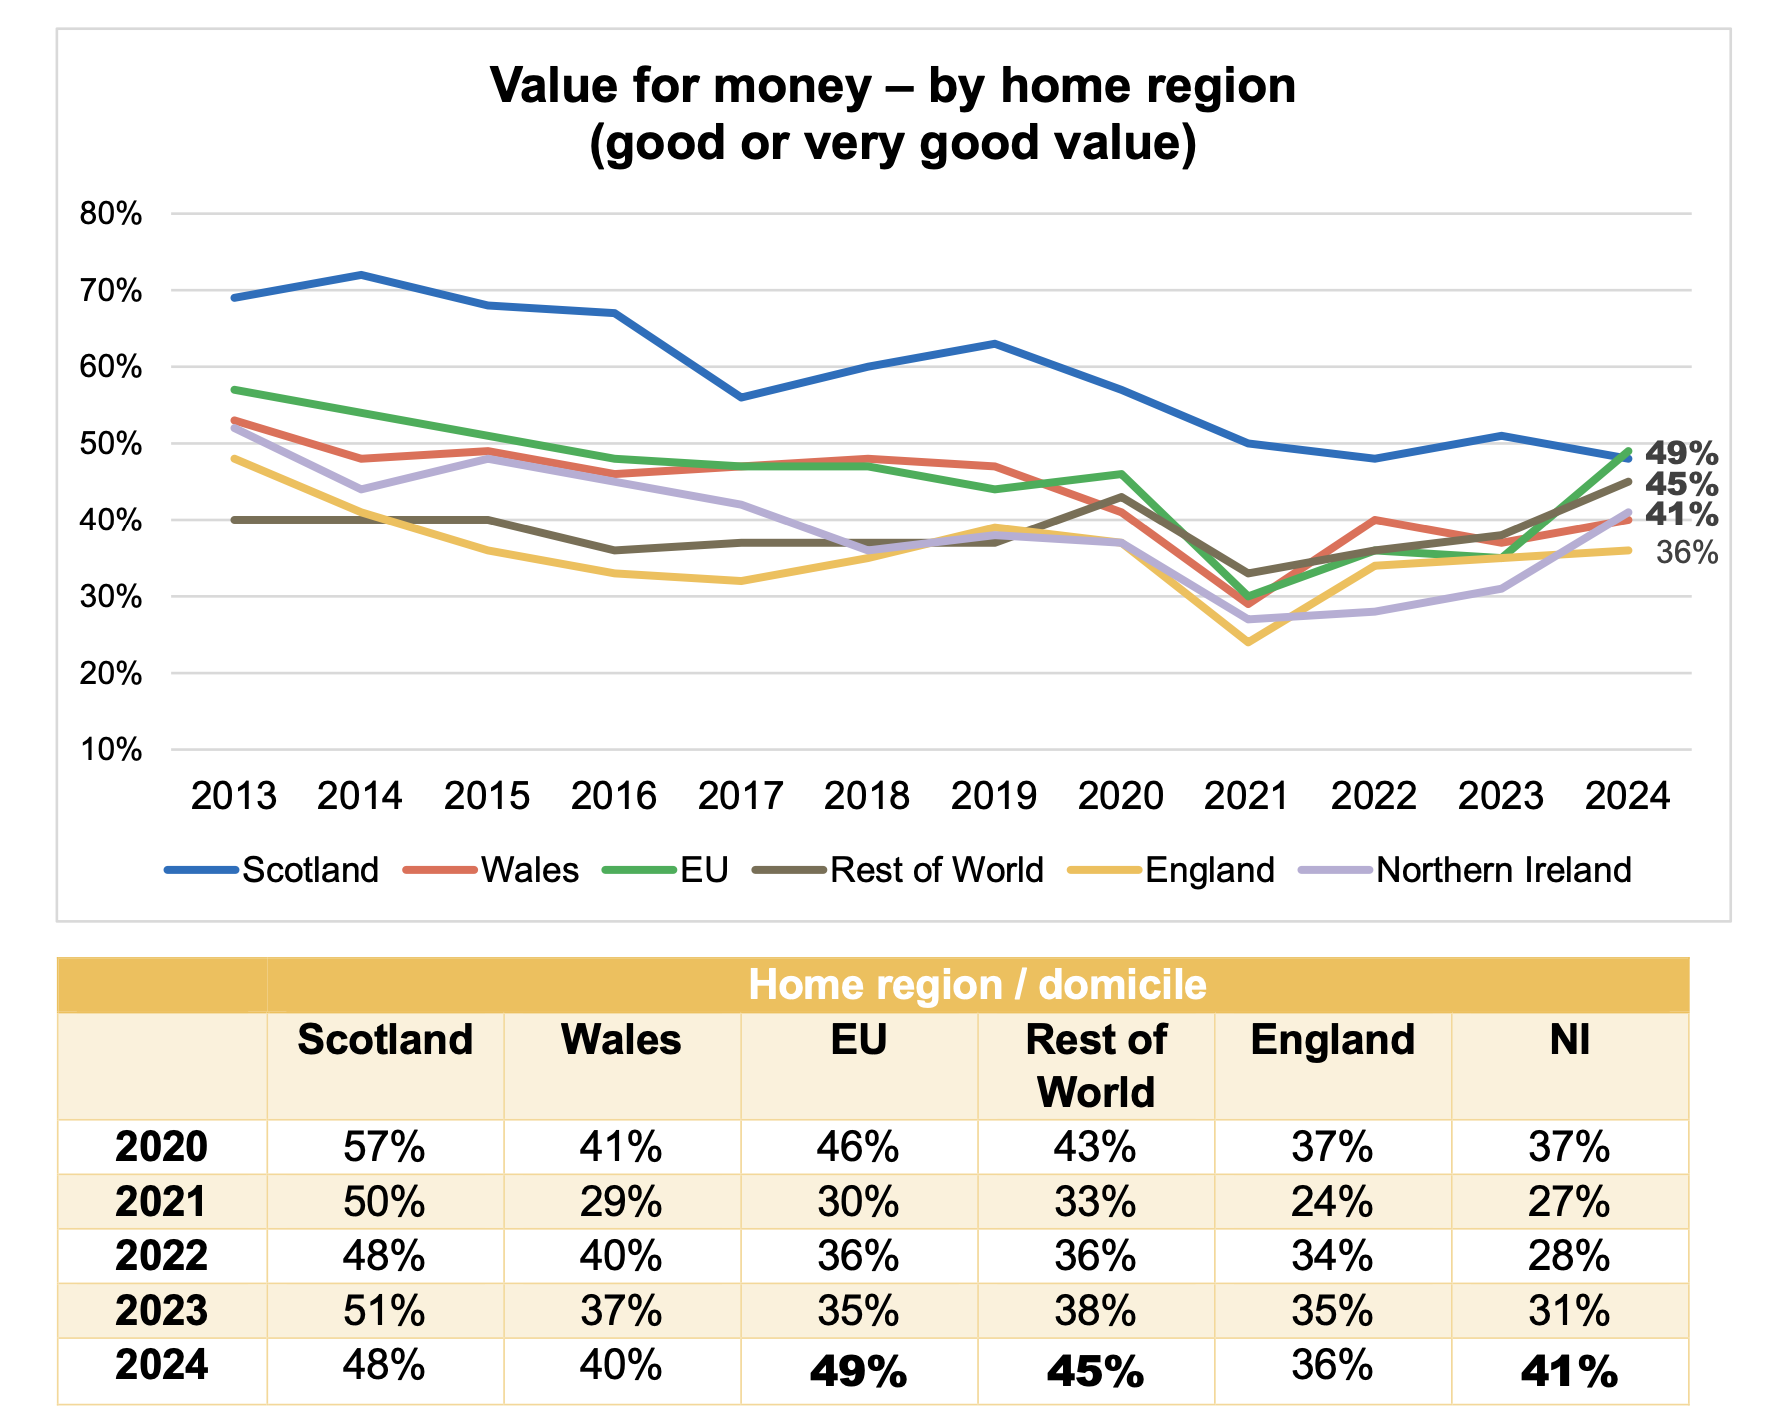
Dive a bit deeper and things get interesting. To the extent to which there’s been an increase, it’s one driven by international students, with those from the EU moving from 35 per cent to 49 per cent, and non-EU international undergraduates moving from 38 per cent to 45 per cent year-on-year. Scotland is always fascinating too – while we can’t see a breakdown of who’s studying elsewhere (this is where they’re from), Scottish student VFM positivity has collapsed from 70 per cent a decade or so ago to just 48 per cent now.
Within all that, there’s quite a marked social class divide – 42 per cent of those from social grades A and B think they’ve had value, while just 34 per cent from grades D and E think the same. VFM perceptions for care experienced and estranged students are down at 34 and 31 per cent respectively. And there’s a fascinating relationship with contact hours – 35 per cent of those on under 9 hours a week thought they’d had value, rising to 43 per cent for those on more than 30 hours.
That isn’t to suggest that providers seeking to improve value perceptions should allocate more hours of contact even they could afford to – it’s medicine and dentistry driving a lot of those high hours, and worth noting that VFM satisfaction for subjects allied to medicine (usually nurses) is over 10 percentage points lower than it is for doctors.
What it does all point to is students’ ability to take advantage of what’s on offer – and so it’s no surprise that of the factors influencing perceptions of poor value, cost of living hits a high this year of 44 per cent – with the influence of contact hours experiencing a notable drop.
It’s also worth noting that it’s those in halls (45 per cent) and those in house shares (56 per cent) that are most likely to say cost of living is driving poor value perceptions – suggesting that soaring rents are becoming a bigger and bigger problem.
The heartbreaking bit is when we compare both expectations being met and VFM perceptions between those impacted by the cost of living crisis and those not. For example, of those impacted by the crisis, 38 per cent have had a worse experience than they expected – contrasted with 17 per cent of those not affected. It suggests that both the inflation crisis, and the failure to address it via student financial support, really has ruined university for a lot of students.
I’ve had a few
One of things I always try to keep an eye on is regret – measured here by whether students, if they had their time again, would make the same choice(s) of university and course. There’s been a small overall improvement this year 60 per cent – but again it’s in the splits that we see the big differences.
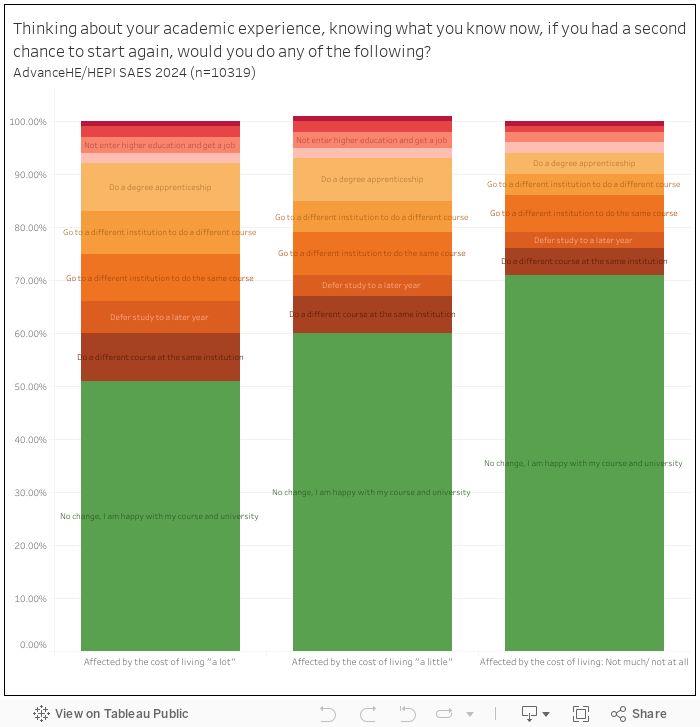
Of those not affected by the cost of living crisis, 7 in 10 would do it all again – collapsing to just 50 per cent of those impacted “a lot”.
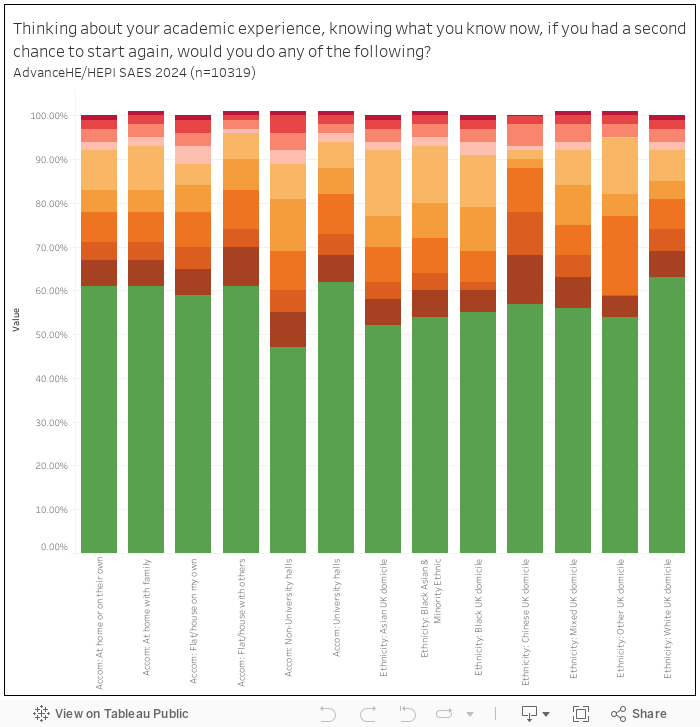
Private halls providers should probably ask themselves why just 47 per cent of their residents would do it all again, and we should probably ask why it is that 63 per cent of white students have no regrets, but only 54 per cent of BAME students do. Care experienced and estranged students are also much less likely to be happy with their choice – as are disabled students.
Given actual drop-out remains fairly low, we should also take a look at who’s more or less likely to be considering leaving – feeling trapped, in other words. The headline average is a quarter of all students, down from 29 per cent in 2021 – but again underneath the mean there are major differences. The female “considered leaving” factor is 29 per cent, compared to just 20 per cent for males – 33 per cent of those in non-university halls have thought about it, and 37 per cent of LGB+ students have.
Shockingly, 36 per cent of disabled students answered yes on this question, and again there are big differences when we look at cost of living impact – 39 per cent of those it’s impacted a lot have considered jacking it in, while just 19 per cent of those unaffected said the same.
To you they belong
Here in Team Wonkhe we’re always interested in who says that they belong and who doesn’t given its demonstrable link to both satisfaction and outcomes, other stuff like mental health, and things like propensity to consider dropping out. In these results just 45 per cent of those who’d considered dropping out had a sense of belonging, versus 70 per cent for those who hadn’t, and there’s a strong correlation between belonging and both VFM and expectations met/exceeded too.
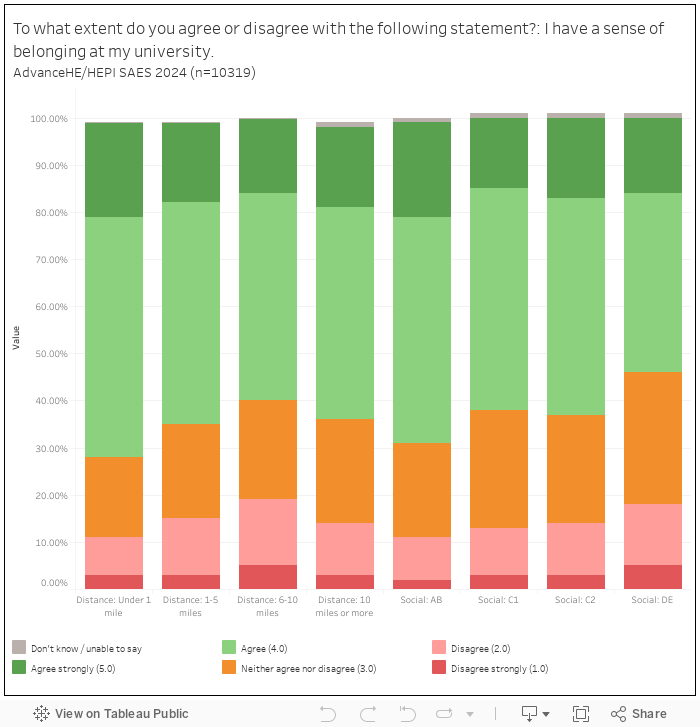
As we’ve seen in other studies, distance from campus is a major factor here – if you’re on campus or next door to it, 72 per cent feel they belong – but for those 6-10 miles away, that falls to just 60 per cent. As in other studies, disabled students are less likely to feel they belong, and should probably shame a sector to find that 68 per cent of social grades A and B belong while only 54 per cent of students from D and E do.
Loneliness is fairly evenly spread around the demographics, subjects and so on – notably of those who say their experience has been worse than expected, three quarters are lonely daily or weekly, dropping to 46 per cent where expectations were met. Meanwhile 7 in 10 students are lonely daily or weekly if they’ve been impacted by the cost of living crisis “a lot” – while only 4 in 10 are lonely if they’ve not been impacted by it at all.
There’s also – as we see in other surveys – a whopping 20 percentage points differential between disabled students and non disabled students on loneliness, with 7 in 10 saying they’re lonely daily or weekly. That disabled students are entitled to “reasonable adjustments” and often funding support for their programme, but not in relation to extracurriculars or social activity, is starting to look like a huge issue given the likely relationship between the two.
Time won’t give me time
One major headline in the press briefing was about time – last year for the first time there were more students in the survey in paid employment (55 per cent) than those who were not (45 per cent). That hasn’t really changed this year, and nor has who’s more likely to be in a job – but what has is hours worked, now up to 14.5 hours on (mean) average.
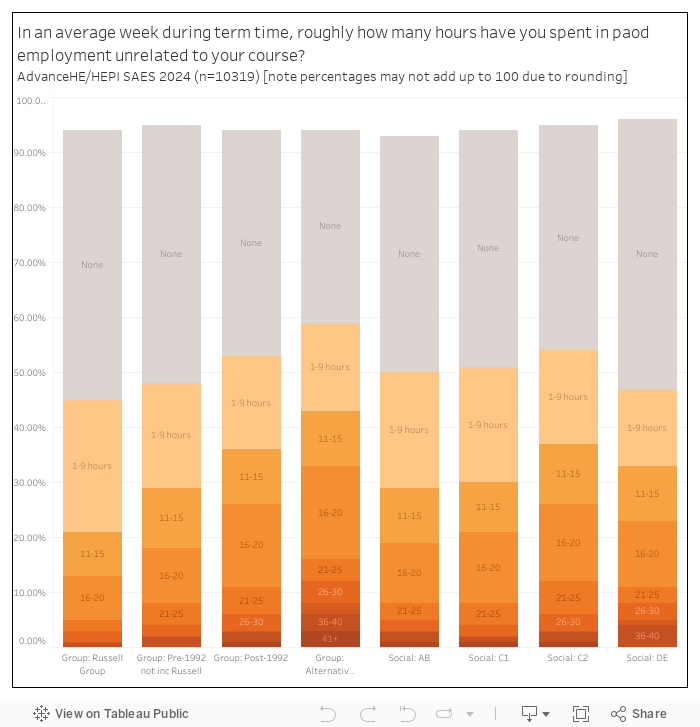
The differences here are quite astonishing. If we look at who’s working more than 15 hours a week – the amount that pretty much every study says over which there start to be negative impacts for full-time students – in the Russell Group the percentage is 13 per cent, in post-1992s it’s a quarter, and in alternative providers it’s a third.
There’s a tendency, I think, to assume that students are working alongside study to top up their own income – and to be fair, 74 per cent say they’re doing it to “supplement my living costs” in this sample. But we tend to underestimate the extent to which they might be supporting others – here 33 per cent of commuter students are working to provide financial support to friends or family, while just 10 per cent of typical residential students say the same.
This year we get new insight on why students might not be in part-time work. 23 per cent say they don’t need the money – with differences you would expect by social grade. Worryingly, a third say they do need the income, but can’t find a job – falling to a quarter for white students, rising to 36 per cent for BAME students, and showing up as a startling 45 per cent for international students. The need for providers to help students find good work, flexible part-time work has never been stronger.
Add it all up – contact hours, time in part-time work and independent study – and students in this sample are now working over 40 hours a week on average. I say “all” – the questions don’t include travel time (either to campus or work), and our own polling suggested that the more hours you’re in employment, the more you’re on a bus or train, which all adds up too.
Even with the data in the SAES, if we only look at those who are working part-time, we’re on 47 hours a week – and it’s almost 50 hours for care experienced students, those who are estranged from parents and those from Polar 1 areas.
And how are they coping? Of those who use “never” use AI tools in their studies, total hours in work and study average 38. But for those using AI tools on a “daily” basis, total average hours in study and work are 50.
Artificial learning?
The question on AI – framed here as “how often, if at all, do you use Artificial Intelligence (AI) tools in your studies in a way that is allowed by your institution”, is interesting because we get frequencies – 8 per cent say they’re using it every day, a quarter say once a week, about 15 per cent say once a month, and another 15 per cent say less than once a month – with a surprising 38 per cent saying “never”.
Fascinatingly, students who have “never” used AI are more likely to be happy, in retrospect, with their course and provider (65 per cent compared to 58 per cent). Maybe that’s a facet of who’s more likely to use it (Computing students), or maybe it’s about how busy students are coping.
There are big differentials here that could give us clues. If we just look at those saying daily or weekly, while the average is 31 per cent – men are up on 40 per cent, and women on 25 per cent, which may well intersect with subject. Non-EU international students are almost twice as likely to be using the tools – 51 per cent versus 27 per cent of home students – and Black UK domiciled students are on 41 per cent, while white UK domiciled students down at 21 per cent.
That also probably tells us more about subject than whatever else might be in folks’ heads – in this sample Black students are most likely to be studying computing, a subject where unsurprisingly 52 per cent of students say they’re using AI daily or weekly.
Feedback
One thing that the survey goes into in some detail is aspects of the student learning experience – and it was feedback that my eyes were drawn to here. Overall just six in ten students said that they got feedback back in time to be useful for their next assignment – with the Russell Group significantly below average, and specialist and alternative providers above average.
There’s a similar story on feedback usefulness and general feedback on progress. Maybe RG students are more demanding – or maybe there’s more of a “see how they perform” as opposed to “help them learn” vibe up in the elite institutions.
So many of the questions are dangerous to interpret by student characteristic because of the distributional differences and intersectionalities of subject – but I think it’s fairly safe ground to look at aspects of teaching satisfaction by provider type. If we look at “all/majority” on different aspects of teaching, the Russell Group comes out worst on staff “motivated you to do your best work”, “were helpful and supportive”, “clearly explained course goals and requirements”, “regularly initiated debates and discussions” and “helped you to explore your own areas of interest”.
In fact the only standout success for the RG in teaching was “encouraged you to take responsibility for your own learning”, which might not be the positive that the question thinks it is when students were filling this out.
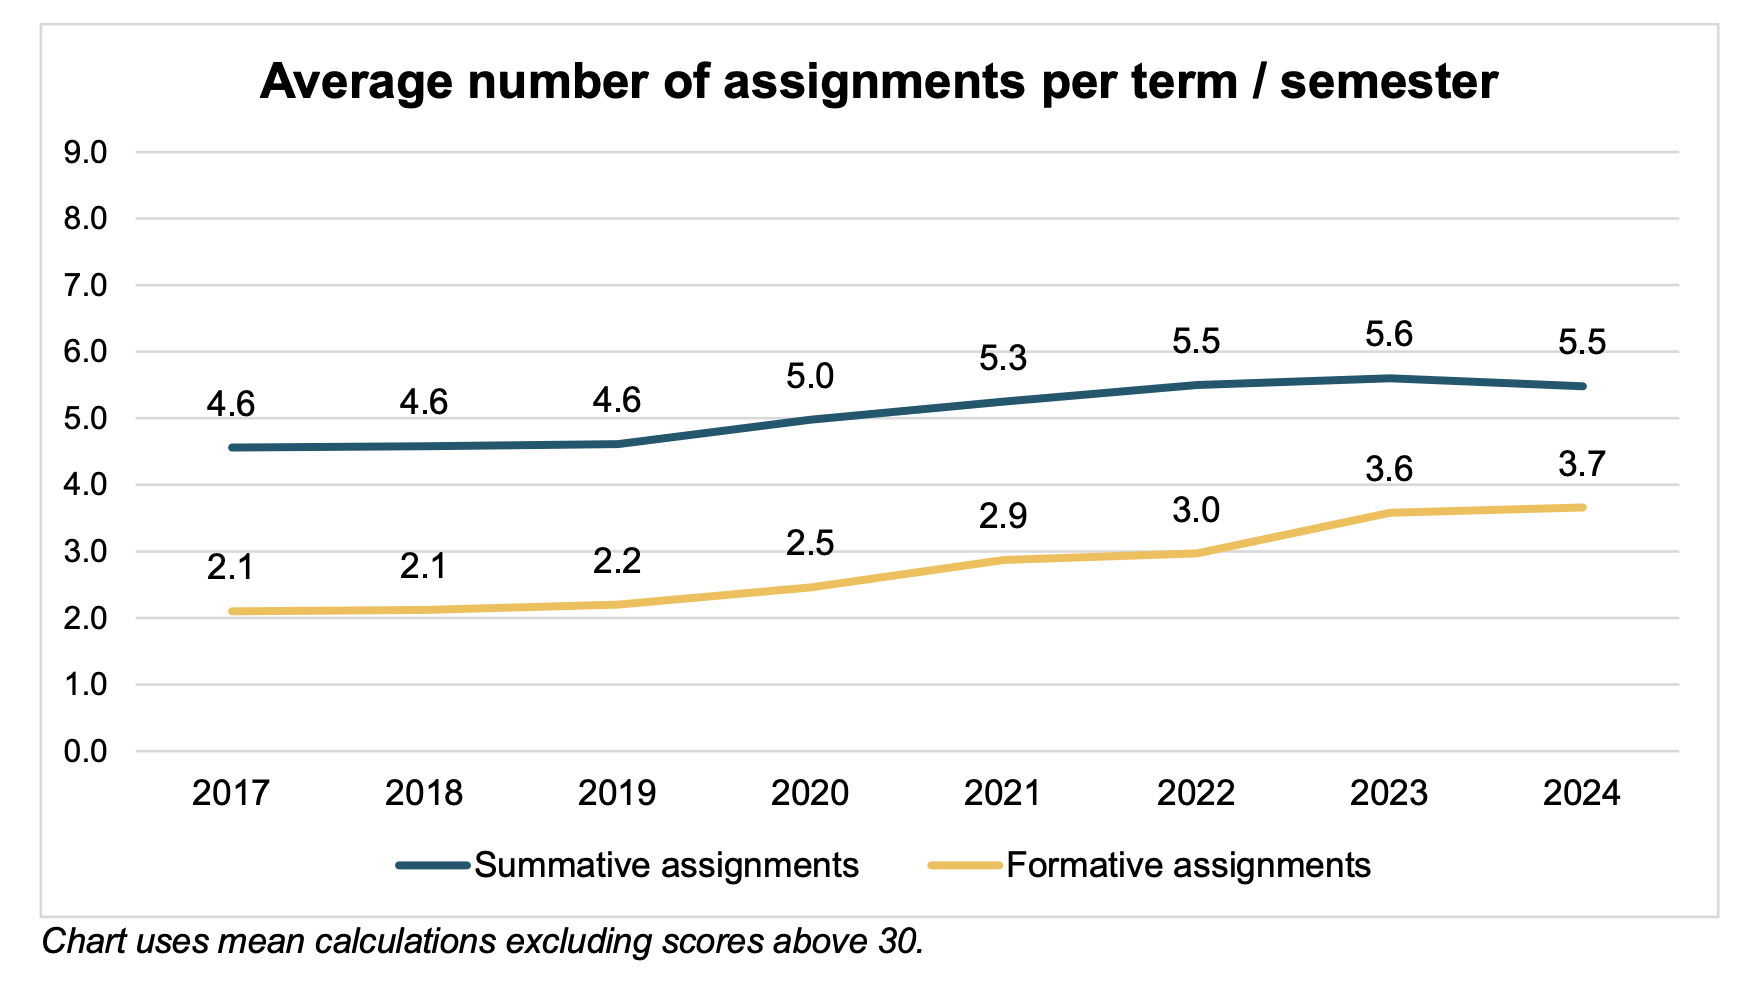
The sector also doesn’t seem to have made much of a dent into the volume of assignments problem. Volume increased strongly around the time of the pandemic, and then continued to rise up to 2023 – and it’s pretty much stuck at 5.5 per term/semester.
And on free speech, we again get reflections on being comfortable to express a viewpoint, hearing a wide variety of opinions expressed on campus, and the curriculum being sufficiently inclusive and diverse. The caricature is right-wing or socially conservative students feeling silenced – but in this sample it’s Black, Asian and minority ethnic students that score lowest on all three factors.
Listening to students
The recommendations bit of the report points out that the cost-of-living crisis is a major factor affecting students’ perception of value for money, with one in ten considering withdrawal due to financial difficulties, and three-quarters stating their studies are impacted. It argues that students part-time working on average 14.5 hours per week is an unsustainable situation that needs government intervention to ensure adequate funding, and says that providers should facilitate part-time work – as well as considering “welfare checks” during registration to tailor support for busy students.
I was more taken with the analysis of free text comments in the report – and the things that students themselves recommend. Students want more and better-quality academic support, particularly over access to academic staff and feedback – and even if they struggle to attend, they want more contact hours and meaningful interactions with supportive and responsive academic staff.
Their views on curriculum are especially interesting. They want academic activity that is “relevant, practical, and connected to the real world” – more practical, context-specific learning through real-world examples, authentic teaching methods, and assessments to enhance engagement and employability. They also talk about the need for work-integrated learning opportunities like placements, internships, and industry collaborations, and want career advice and planning embedded throughout their course, including guidance on internships, job placements, skill-building opportunities, and career counselling.
When they are on campus, they appreciate smaller-group teaching and increased opportunities for group-based work for in-depth discussions and a sense of community. Off campus, students also want the flexibility provided by online options, noting the benefits for access, participation, and managing personal schedules. They want their time on campus to be more magical – and as someone said in one of our surveys last year, less like:
…going to the cinema on your own (with catering that’s just as expensive).
As we’ve known for years from the NSS, organisation and administration are key indicators of their academic experience – improved timetabling, workload management, and assessment distribution are still up there. Students say they face real challenges with late timetables, inconvenient scheduling, and session cancellations – and signal the importance of evenly distributing workload and assessments across modules and terms to prevent clustering of deadlines, which hampers their ability to produce quality work and receive timely feedback.
And despite the moans about “shiny buildings”, students do want better study spaces like as more group study areas and well-equipped labs, as well as enhanced online learning platforms and educational materials. Improved technological infrastructure is needed to facilitate seamless online learning, incorporating advanced e-learning platforms, virtual labs, and interactive multimedia resources. And issues with current facilities, like inadequate computers and software, speak to the need for reliable and high-quality equipment to support their studies effectively.
They also talk of the critical need for accessible and timely mental health support. Given over 30 per cent of undergraduates disclosed mental health conditions in 2021-22, the actual number is likely higher due to underreporting. Both the pandemic and rising living costs have exacerbated these issues, and students still want more mental health support services, including counselling and well-being programs, to ensure they can thrive academically and manage personal adversities. Reducing wait times for counselling also shows up in the comments.
Of course, all of that costs money that the sector doesn’t have. And so with universities less able to provide what they want, and students less likely to be able to take advantage of what there still is given their own financial precarity, we can only assume that the pincer is squeezing out the sort of experience they should be getting.
Should they be here?
Overall for the report, while some aspects appear to show types of improvement and others show a worsening year on year, the main message remains constant. It is important to focus in on what is in a provider’s gift – but increasingly it’s aspects outside of a provider’s direct control that appear to be influencing the experience that students have. Quality (and indeed value for money) is becoming less and less about “provision” per se, and more about students’ ability to engage in it.
As I concluded last year, you can build the best provision in the world – but it will only matter if students can make the most of it. And if you can’t build the best provision in the world – taking steps to maximise students’ ability to access and engage with it may well be more impactful than endlessly tweaking it.
But my other conclusion is that we are now, for many students, well beyond a point where they or their provider are able to take sufficient steps to ensure they have a decent experience. The “new normal” may well be that students are working and studying silly hours to better their lives. But it’s almost certainly bad for their health – and those stretched to the limit are almost certainly less likely to have the time to immerse, pick up the soft skills and social capital, and get the labour market or life advantages that they’re paying for.
Universities tend to get the blame for poor labour market outcomes, and debates about financing universities to support students and national maintenance support tend to be weighed up on access terms alone. It’s high time for the sector to scream from the rooftops about the differential experiences that students are having that will almost certainly lead to sharply different outcomes, and to admit that some students shouldn’t be at university at all – not because they wouldn’t benefit immensely from it, but because as it stands, they just can’t.


Looking at the numbers, and your analysis, it would seem Universities are now stuck with a situation they cannot do much, if anything, to change. The disabled student responses come as no surprise, especially where their social lives are concerned, many extra curricular activities organised by student cubs and societies are for the able bodied/minded, unless sufficient disabled students, and staff, get involved that won’t change, no matter how many ED&I courses organisers are mandated to attend, from direct experience mandated ED&I courses actually turn potential allies off into antagonists.