


The Education Department finally got around to releasing the 2017 Finance Publication. The release of the scant library of federal annual reports has been slipping over the years, but this might be the new low water mark.
Whether it was delayed for political reasons – so Education Minister Dan Tehan could beat up universities with its contents at their annual conference – or due to lack of sheer manpower in the department, one wouldn’t know.
Anyway, the 2017 Finance Report might already be dated but it still makes interesting reading.
Strong and stable
For the purposes of this article, we compared 2017 to 2012 which was the first full year of the demand driven system to see how the sector and individual institutions are shaping up.
Some fundamentals. First up, in 2017 the total revenue for the sector was $32 billion (including VET activities among the dual sectors), up from $25.2 billion in 2012 – a whopping 25% increase in six years.
Over the same period there has been a 20% increase in student enrolments.
This is a sector that has grown rapidly in a very short period of time. That growth has has been fuelled by both domestic students due to the uncapping of student places (15.8% increase) and a massive rise in overseas students from 323,600 to 431,440 (33% increase).
Between 2012 and 2017 there were no significant policy changes to the university sector. (But thankfully there were some aborted reforms, including the marketisation of student fees, which failed to pass Parliament in 2015.)
As a result the HE sector has been stable and the status quo maintained – not because the settings are perfect, but largely because of political ineptitude, inertia and disinterest.
Just before we start, I need to note that I have not included Batchelor Institute of Indigenous Tertiary Education in any of my observations. From memory it was merged with Charles Darwin in 2011. Also, it is so small and atypical it skews the bottom end of the data.
Revenue and expenditure
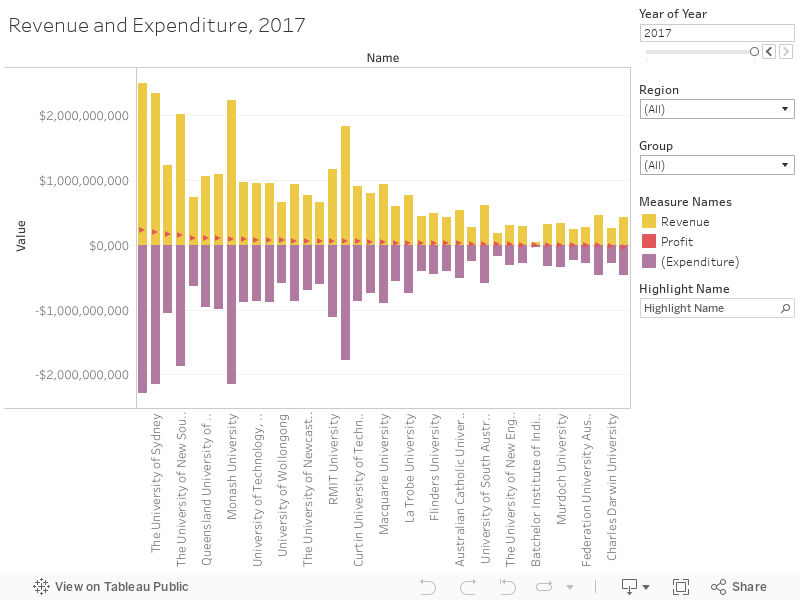
First up, a brief explanatory note. Surpluses in Australian HE accounting are not a true reflection of an institution’s finances. For some curious reason, accounting standards include one-off infrastructure and research grants in revenue. There was a push a few years ago for universities to note the actual surplus in their annual reports, but that rarely happens. Melbourne University, however, has done that. In 2017, it recorded the biggest surplus by a country mile ($223 million), but its annual report documents the actual surplus as a much more sober $26m.
This point is worth noting because Education Minister Dan Tehan planned on using the combined $2bn surplus as proof of the sector’s profligacy at the recent Universities Australia conference (as revealed in leaked speech notes to media). It’s not just an unsophisticated reading of the Finance Report but a misrepresentation.
However, I am using the reported (not actual) surplus here as it provides a rough proxy for financial health.
Six of the ten universities that had the highest surpluses in 2017 were also in the top 10 in 2012. They are Melbourne, Sydney, UNSW, QUT, Deakin and Monash. My takeaway from this is twofold – bigger is certainly better. The four Group of Eights are significantly larger on most criteria than other universities in the sector.
Also, four of these universities had the same vice-chancellor in 2017 as in 2012 – Melbourne, Sydney, QUT, Deakin. From this I think we can see that strong, consistent leadership with a clear vision is an institutional good. Go figure!
We can also see that six of the bottom ten in 2017 were also in the bottom ten in 2012. In other words, it’s hard for under-resourced and stressed institutions to rise above themselves. (However, it’s not impossible as Newcastle and RMIT have shown in the past 15 years or so). Six of the bottom ten are regional institutions – and five are the same as in 2012.
However, the financial situation for those at the bottom of the ladder is getting worse.
In 2017, six institutions were in deficit and all but one were regional.
The non-regional is Victoria University, which got hit early by the impact of the demand-driven system and has struggled to recover ever since. It has reported deficits for five of the past six years. (VU is now hanging its hopes on a new undergraduate model of education known as the block model – despair can sometimes open the door to innovation). Southern Cross University and Charles Darwin have also both racked up three deficits each in the past five years.
As Andrew Norton, higher education expert with the Grattan Institute says: “There is certainly an issue with the number of universities in deficit, particularly that some are repeating on the list.”
He notes that with the exception of Southern Cross, the 2018 report on student applications, offers and enrolments shows that all in-deficit universities had declining demand in 2018 compared to 2017. That is not good news and one wonders whether there are talks of mergers and takeovers going on behind the scenes (I doubt it, but there probably should be.)
We can also see from this data, how a large number of universities have worked the DDS to their advantage – chief among them is Swinburne University, which went into partnership with Seek Learning in 2011 to create Swinburne Online which now accounts for about 8000 students. Swinburne has moved from 11th bottom in terms of surplus in 2012 to fifth highest in 2017.
It’s also worth pointing out, that while a number of regional universities are struggling, others have managed to negotiate the DDS, as well as enrol significant numbers of international students (I’m looking particularly at Charles Sturt here). These universities have thrived by creating high-rise campuses in metropolitan areas. It’s not an answer to low participation rates in regional areas, but has made for healthy balance sheets.
Another noteworthy observation is that while the sector is obsessed with the historical advantage awarded to Go8s, a number of other universities, particularly Deakin and QUT, are serious contenders. Sandstone status can be outmaneuvered by savvy upstarts.
Government finance
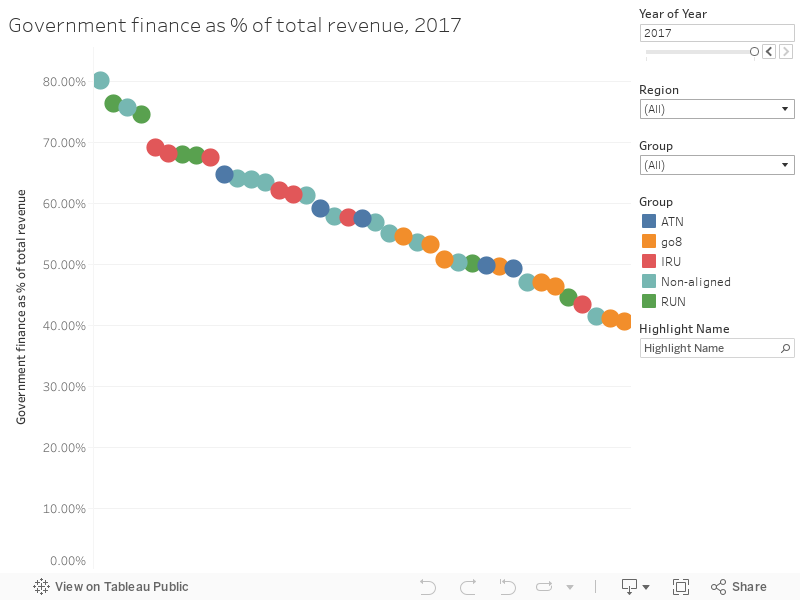
The most notable observation here is the fact that a private university – Notre Dame – is the recipient of by far the highest proportion of government grants (80%). I won’t pretend I am completely across the history of Notre Dame or the State Act under which it was created, but why a private university, which isn’t required to produce an annual report and who’s vice-chancellor is paid an unknown salary, seems a bit odd to a mere bystander like me.
That said, Notre Dame has created a reputation for delivering high-quality, student-focused, low staff-student ratio education in medicine, nursing and teaching.
But two other private universities – Bond and Torrens – are not in receipt of government grants and are therefore not included in the Finance Report. Anomalies beset the sector, as discussed in my last Letter.
This analysis shows that in 2012 there were only four universities which got less than 50% of revenue from government; by 2017 this had grown to eleven. (The Grattan Institute’s Andrew Norton estimates it to be only five, but notes that if only federal funding is taken into account then the larger figure is arrived at).
We can see that over the past six years, universities have not just been the passive (or active) recipients of Commonwealth teaching grants rolling in from the DDS, but have successfully diversified their income streams and consequently reduced reliance on government.
Obviously, the 33% increase in international students has helped this along.
Some universities have made substantial decreases in their their reliance on government revenue (Western Sydney went from 79% of revenue to 69%, Southern Cross from 78% to 68% and Univesity of Southern Queensland from 81.4% to 67.8%). A very small number have seen the proportion of revenue from government increase (Australian Catholic University, James Cook and Swinburne, among them).
International students
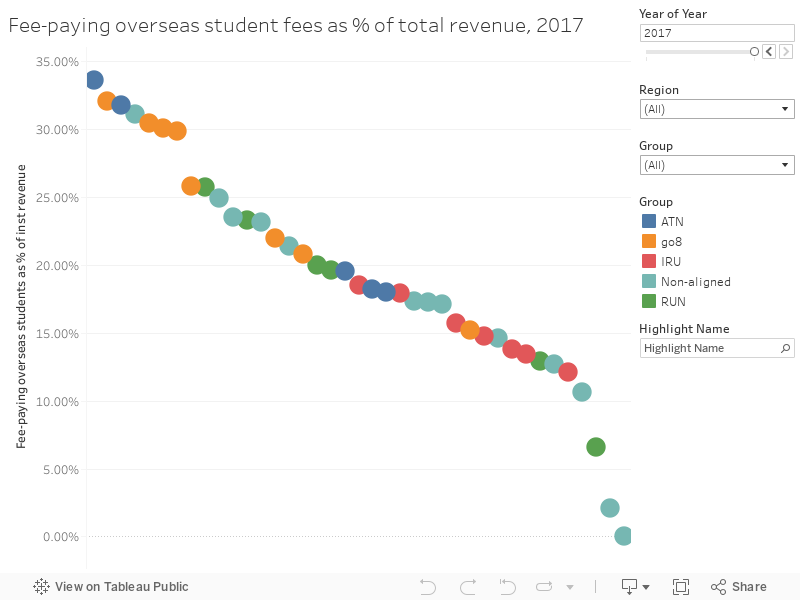
The reason behind the falling dependence on government is international students. And the increases in numbers and dollars since 2012 is, to be frank, eye-boggling.
What we can see a major shift to dramatically increase revenue from international students among most institutions, but most notably among the Go8.
Back in 2012, two regional universities were in the top 10 of international students as a proportion of revenue. Central Queensland University was first at 29.4% ($73.3m) and Federation University was sixth with $60m). There were three Go8s, taking eighth to tenth spots (UNSW, Monash and Melbourne).
Move to 2017 and how things have changed. RMIT takes top spot with 33.6% of its revenue $392m coming from international students, a combination on both onshore and offshore students – it has a large campus in Vietnam.
But look at the Go8. Sydney has moved from 17th position in 2012 to second in 2017 with 32.1% of revenue $752m – just under three times its 2012 revenue of $283m. The Go8 now take five of the top ten spots.
Other big players relying on international students for more than 25% of their revenue are University of Technology Sydney, Macquarie, Central Queensland and Charles Sturt – the last two proof that regional universities can be major players in this space – but only if they emulate their city cousins by setting up high-rise city campuses. CSU’s revenue growth went from $39m in 2012 to $149m in 2017.
Only 3% of international students go to regional campuses. Obviously, the lure of the bush is not luring students from Shanghai.
At the bottom end we see, unsurprisingly, that Notre Dame as the least engaged in international education – whether as a strategy or complacency is not known. Just 2.11% of Notre Dame’s revenue came from overseas students (a mere $3.8m). The University of New England still hadn’t cracked the genie in the bottle. Only 6.5% of its revenue – or $20.3m comes from overseas students.
From what I can see, the only university to go backwards in revenue (but proportion is relatively stable) is Murdoch University. It’s revenues fell from $49.3m in 2012 to $41.4m in 2017.
Indeed, Western Australia in which Murdoch in located has acknowledged its failure as a state to capitalise on the international student boom in recent years. A new strategy which is attempting to address that failure is currently in play.
Just an aside, while the growth in international students has been phenomenal (and as we keep hearing Australia is on track to overtake the UK in actual numbers this year), there is the beginnings of a push from within to start to cap or limit international students.
Brian Schmidt, vice-chancellor of Australian National University, has announced last year that numbers at his institution would be capped (ANU more than doubled revenue from $98m to $254m between 2012-17). Earlier this month he also said he would cap domestic student enrolment growth. I’ve heard – on the quiet – senior players in this space say that capping numbers or being more selective in the types/quality of students allowed to come here is essential if we are to keep the sector’s reputation in shape.
Marketing
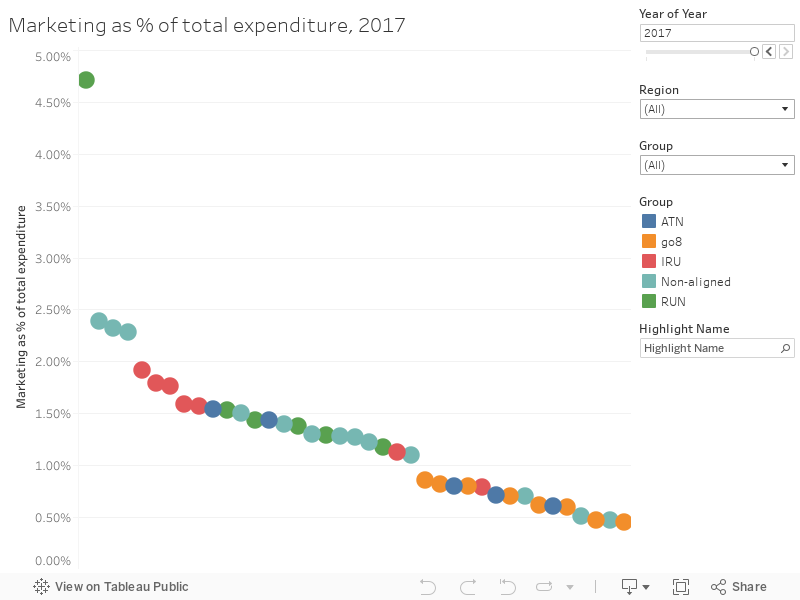
Pretty everyone agrees that marketing budgets are neither here nor there. But that doesn’t stop education ministers jumping on the precarious bandwagon to condemn universities for “wasting” precious resources on marketing.
As Norton says: “The marketing spend is a non-issue. In 2017, more than 90% of coursework student places were distributed through markets or quasi-markets (DDS). It’s absurd to say that the universities that don’t have students lining up to get in due to historical status should not promote themselves to potential students. The overall spend at just over 1% of all expenditure is if anything surprisingly low.”
There are many more takeaways from this data and I’d love to hear from you. Tweet me @harejulie.
Visualisations by David Kernohan, Wonkhe.


Dear Julie,
Great piece and excellent you kicked off by cautioning and explaining why financial data collected by the Australian government about our universities do not accurately reflect their true financial positions. Other sources of revenue not properly accounted for currently in these official figures include specific purpose donations and non-government research contract income.
One question: in your analysis do you treat student contributions backed by the various HELP schemes as ‘Government Finance’? I’m thinking not, because you exclude Bond and Torrens, both of which would – I assume – receive income via the Government through FEE-HELP. But then again, so would Notre Dame, and I had initially wondered whether that may be the reason for its 80% ‘Government Finance’ figure. There must be another explanation if HELP is not included and maybe it has to do with the Commonwealth Grant Scheme funding Notre Dame receives for Cth-Supported students enrolled in its medical program? Also, if your analysis doesn’t include HELP payments, I’m a little surprised by the 41% figure for USyd in your second chart. The figure we have for the Federal Government share of total revenues in same year – excluding student contributions deferred through the various streams of the HELP – is a fair bit lower than 41%. It would be somewhere around that level though if HELP is included in your ‘Government Finance’ category.
Best,
Tim